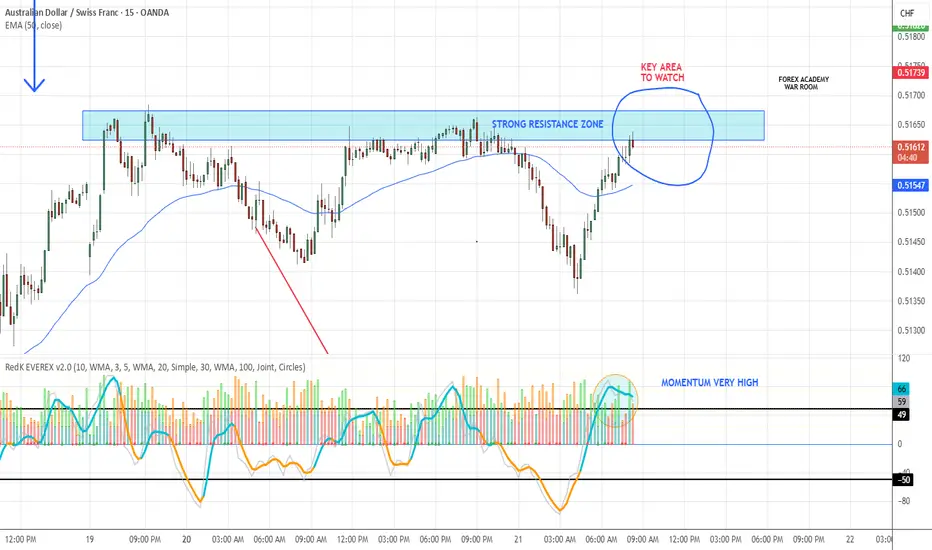
On the 15-minute timeframe, AUDCHF is pressing into a solid resistance zone. Momentum is already high, suggesting the potential for a down move.
But remember: the 15M chart can be much more volatile than higher timeframes. For a confirmed VMS setup, we still need:
✅ A clean engulfing candle to the downside
✅ Volume spike (75+) to show strong intent
Until those triggers align, this one stays on watch. Patience first — the signals will tell us when to act.
#Forex #AUDCHF #VMSStrategy #TradingView
Declinazione di responsabilità
The information and publications are not meant to be, and do not constitute, financial, investment, trading, or other types of advice or recommendations supplied or endorsed by TradingView. Read more in the Terms of Use.
Declinazione di responsabilità
The information and publications are not meant to be, and do not constitute, financial, investment, trading, or other types of advice or recommendations supplied or endorsed by TradingView. Read more in the Terms of Use.