📊 Understanding the Head & Shoulder Pattern
Definition: The Head & Shoulder (H&S) pattern is one of the most recognized reversal formations in technical analysis. It consists of three peaks:
Left Shoulder: A rise followed by a decline.
Head: A higher rise followed by another decline.
Right Shoulder: A smaller rise, often mirroring the left shoulder, followed by a decline.
Neckline: The support level connecting the lows after each peak. A breakdown below this line often signals a bearish reversal.
👉 Why it matters: Traders view the H&S as a warning that bullish momentum is fading and a potential trend reversal could be underway.
⚡ RSI Momentum Explained
Relative Strength Index (RSI): A momentum oscillator that measures the speed and change of price movements.
Key Levels:
Above 70 → Overbought zone (possible correction or reversal).
Below 30 → Oversold zone (possible bounce).
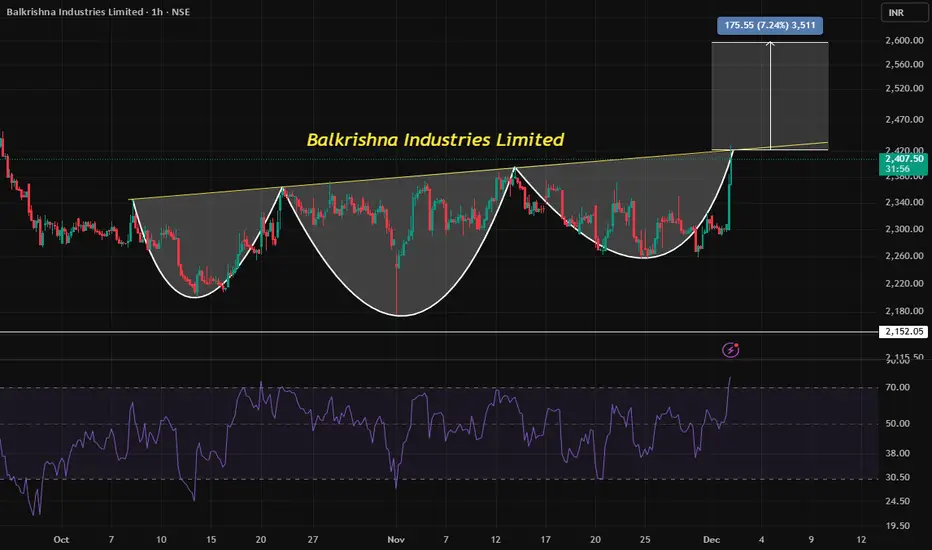
In Balkrishna Industries’ case, RSI moving above 70 on the hourly chart suggests the stock is in an overbought condition, increasing the probability of a pullback.
📌 Current Opportunity in Balkrishna Industries (Trading at 2407)
The stock is forming a Head & Shoulder pattern on the hourly timeframe.
RSI above 70 indicates overheated momentum, aligning with the potential reversal signal from the H&S.
Trader’s takeaway:
Watch for a neckline breakdown to confirm the pattern.
A confirmed breakdown could open opportunities for short trades or profit booking.
Risk management is crucial—false breakouts can occur, so traders often wait for volume confirmation.
🎯 Why Traders Should Care
Combining chart patterns (H&S) with momentum indicators (RSI) gives a stronger signal than relying on one alone.
Balkrishna Industries at 2407 is at a critical juncture—either it sustains momentum or confirms reversal.
For traders, this is a classic setup where technical analysis provides a roadmap for potential profit opportunities.
🔥 In short: "Balkrishna Industries is shouting reversal—will you listen to the charts?"
Definition: The Head & Shoulder (H&S) pattern is one of the most recognized reversal formations in technical analysis. It consists of three peaks:
Left Shoulder: A rise followed by a decline.
Head: A higher rise followed by another decline.
Right Shoulder: A smaller rise, often mirroring the left shoulder, followed by a decline.
Neckline: The support level connecting the lows after each peak. A breakdown below this line often signals a bearish reversal.
👉 Why it matters: Traders view the H&S as a warning that bullish momentum is fading and a potential trend reversal could be underway.
⚡ RSI Momentum Explained
Relative Strength Index (RSI): A momentum oscillator that measures the speed and change of price movements.
Key Levels:
Above 70 → Overbought zone (possible correction or reversal).
Below 30 → Oversold zone (possible bounce).
In Balkrishna Industries’ case, RSI moving above 70 on the hourly chart suggests the stock is in an overbought condition, increasing the probability of a pullback.
📌 Current Opportunity in Balkrishna Industries (Trading at 2407)
The stock is forming a Head & Shoulder pattern on the hourly timeframe.
RSI above 70 indicates overheated momentum, aligning with the potential reversal signal from the H&S.
Trader’s takeaway:
Watch for a neckline breakdown to confirm the pattern.
A confirmed breakdown could open opportunities for short trades or profit booking.
Risk management is crucial—false breakouts can occur, so traders often wait for volume confirmation.
🎯 Why Traders Should Care
Combining chart patterns (H&S) with momentum indicators (RSI) gives a stronger signal than relying on one alone.
Balkrishna Industries at 2407 is at a critical juncture—either it sustains momentum or confirms reversal.
For traders, this is a classic setup where technical analysis provides a roadmap for potential profit opportunities.
🔥 In short: "Balkrishna Industries is shouting reversal—will you listen to the charts?"
Declinazione di responsabilità
Le informazioni e le pubblicazioni non sono intese come, e non costituiscono, consulenza o raccomandazioni finanziarie, di investimento, di trading o di altro tipo fornite o approvate da TradingView. Per ulteriori informazioni, consultare i Termini di utilizzo.
Declinazione di responsabilità
Le informazioni e le pubblicazioni non sono intese come, e non costituiscono, consulenza o raccomandazioni finanziarie, di investimento, di trading o di altro tipo fornite o approvate da TradingView. Per ulteriori informazioni, consultare i Termini di utilizzo.