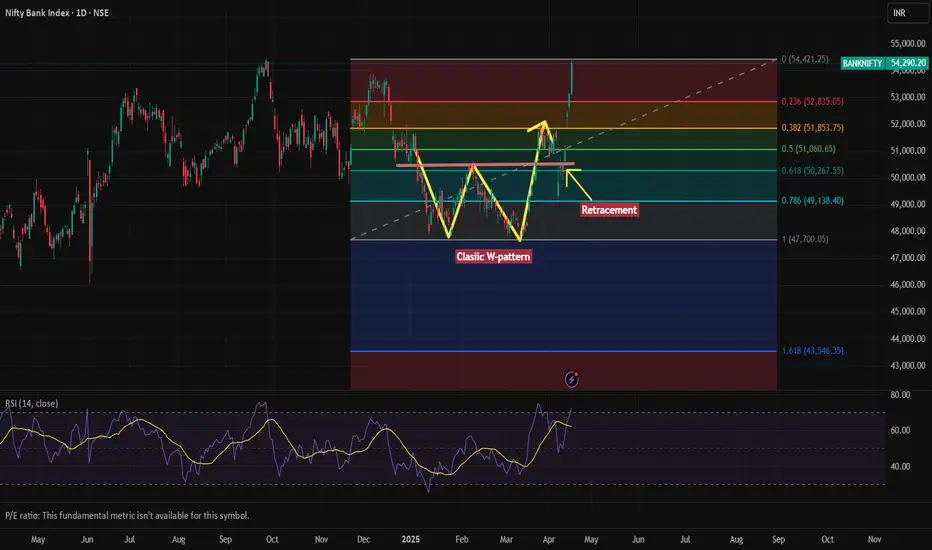
This chart represents the **Nifty Bank Index** (BANKNIFTY) on a daily timeframe and showcases a technical analysis using:
1. **Fibonacci Retracement Levels**
2. **A Classic W-Pattern (Double Bottom)**
3. **RSI (Relative Strength Index)** at the bottom
---
### 🔍 **Pattern Analysis**
#### 📈 Classic W-Pattern (Double Bottom)
- A W-pattern, also called a double bottom, typically indicates a **reversal from a downtrend to an uptrend**.
- It’s clearly marked in yellow, showing the index formed two distinct lows around the same level.
- This formation was followed by a **bullish breakout** above the neckline (horizontal resistance), confirming the pattern.
---
### 🔢 **Fibonacci Retracement Levels**
- The retracement tool is drawn from the swing high (around 54,421) to the swing low (around 43,546).
- Key levels marked:
- **0.236 (52,835)**
- **0.382 (51,853)**
- **0.5 (51,060)**
- **0.618 (50,267)**
- **0.786 (49,138)**
- The price **retraced to the 0.5-0.618 level** (a strong support zone) before resuming its uptrend — a typical bullish retracement behavior.
---
### 🔄 **Recent Breakout & Momentum**
- After retesting the neckline (as indicated by the arrow labeled “Retracement”), the price **broke above previous highs**, signaling strong bullish momentum.
- The latest candle shows a significant upward move, closing around **54,290**, very close to the **previous high of 54,421**, suggesting a potential **breakout into uncharted territory** if volume supports it.
---
### 📊 **RSI Indicator**
- RSI is around **72**, entering the **overbought zone (>70)**.
- This indicates **strong bullish momentum**, but could also suggest a potential for **short-term consolidation or minor correction**.
---
### ✅ Summary
- **Trend**: Strong bullish trend confirmed by W-pattern breakout and higher highs.
- **Support Levels**: 51,060 (0.5) and 50,267 (0.618) are key support zones.
- **Resistance**: Immediate resistance is the previous high at 54,421. A breakout above this could lead to new highs.
- **Momentum**: Overbought on RSI – bullish strength, but monitor for possible pullbacks.
Declinazione di responsabilità
Le informazioni e le pubblicazioni non sono intese come, e non costituiscono, consulenza o raccomandazioni finanziarie, di investimento, di trading o di altro tipo fornite o approvate da TradingView. Per ulteriori informazioni, consultare i Termini di utilizzo.
Declinazione di responsabilità
Le informazioni e le pubblicazioni non sono intese come, e non costituiscono, consulenza o raccomandazioni finanziarie, di investimento, di trading o di altro tipo fornite o approvate da TradingView. Per ulteriori informazioni, consultare i Termini di utilizzo.