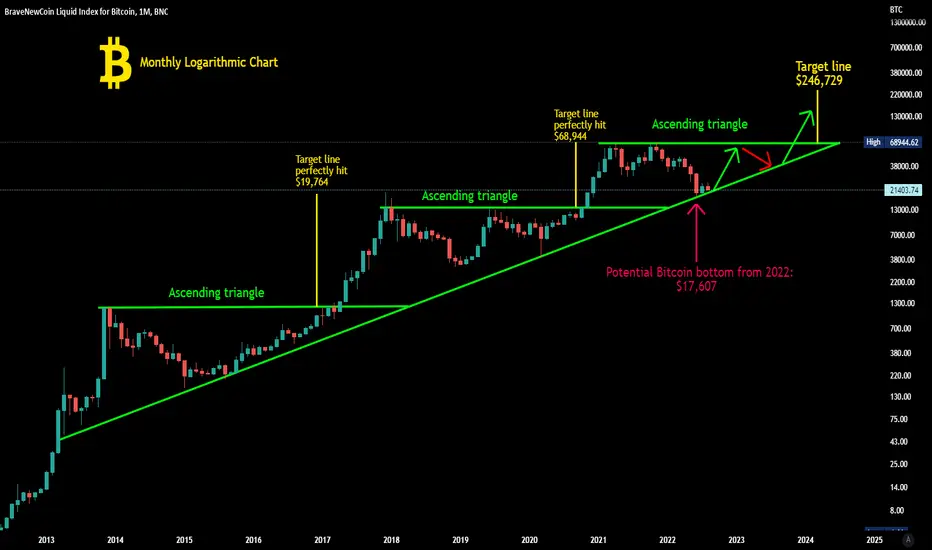
Bitcoin have been forming a strong support line since April 2013 in this Monthly Logarithmic chart, that line have been at the same time the support of continuously ascending triangles that tend to break to the upside normally, and yes we seems to be forming another one right now, this could be one more signal that the bottom is in so be prepare to what it could come the next 2 to 3 years and even Months, this is looking bullish!
Declinazione di responsabilità
Le informazioni e le pubblicazioni non sono intese come, e non costituiscono, consulenza o raccomandazioni finanziarie, di investimento, di trading o di altro tipo fornite o approvate da TradingView. Per ulteriori informazioni, consultare i Termini di utilizzo.
Declinazione di responsabilità
Le informazioni e le pubblicazioni non sono intese come, e non costituiscono, consulenza o raccomandazioni finanziarie, di investimento, di trading o di altro tipo fornite o approvate da TradingView. Per ulteriori informazioni, consultare i Termini di utilizzo.