Bitcoin CME futures are forming a technical pattern that points to a period of consolidation before a potential upward surge, provided that key support levels remain intact.
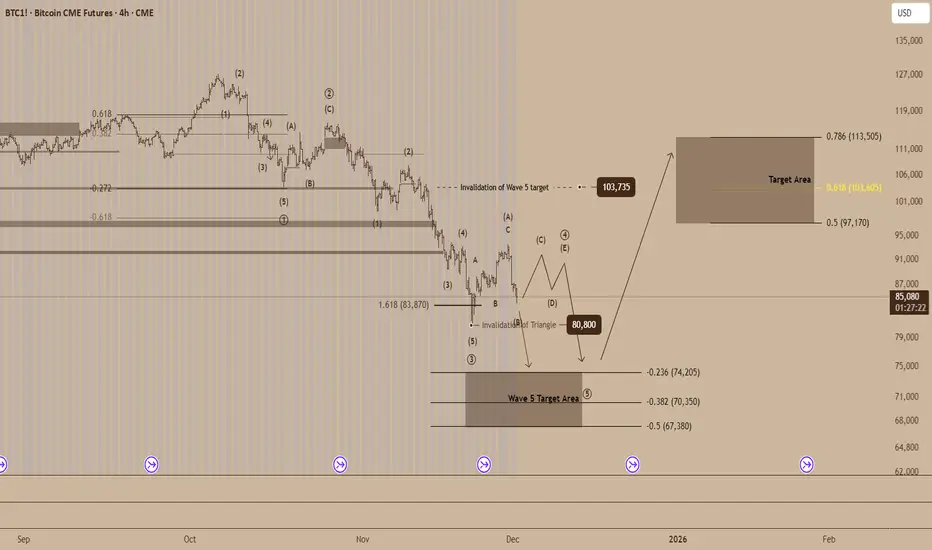
Recent price action indicates the development of a Wave 4 triangle, a structure that often appears when markets pause before continuing their primary trend. The lower boundary of this formation sits near $80,800, which serves as a pivotal support level. A decisive drop below this threshold would disrupt the triangle scenario and suggest that the market may be preparing for a deeper pullback.
The decline into the $83,870 region aligns with the 1.618 Fibonacci extension, a level commonly associated with Wave 3 completion. The subsequent movements from this area resemble an A B C corrective bounce, reinforcing the idea that the market is testing the early stages of a compressing triangle.
If this pattern continues to mature, traders may observe a series of contracting swings labeled C, D and E. A breakout from the final swing would serve as confirmation that the larger bullish trend is resuming. The broader Wave 5 outlook has an invalidation level near $103,735, and a sustained move above this region would signal renewed momentum.
The projected Wave 5 target area spans $97,170 to $113,505, corresponding to the 0.5 to 0.786 Fibonacci retracements. Within this range, the 0.618 level at $103,605 stands out as a key price marker that may attract significant interest if bullish pressure returns.
Conversely, if support at $80,800 fails to hold, attention would shift to the deeper Wave 5 target zone between $74,205 and $67,380, marked by the negative 0.236 to negative 0.5 Fibonacci extensions.
For now, Bitcoin appears to be balancing between consolidation and continuation. Whether this evolving structure resolves higher or signals a larger corrective phase will likely set the tone for the next major move in the futures market.
Declinazione di responsabilità
Le informazioni e le pubblicazioni non sono intese come, e non costituiscono, consulenza o raccomandazioni finanziarie, di investimento, di trading o di altro tipo fornite o approvate da TradingView. Per ulteriori informazioni, consultare i Termini di utilizzo.
Declinazione di responsabilità
Le informazioni e le pubblicazioni non sono intese come, e non costituiscono, consulenza o raccomandazioni finanziarie, di investimento, di trading o di altro tipo fornite o approvate da TradingView. Per ulteriori informazioni, consultare i Termini di utilizzo.