🔎 Overview
____________________________________________________________
📔 Concept
____________________________________________________________
📊 Chart Explanation
____________________________________________________________
👀 Observation
____________________________________________________________
💡 Conclusion
____________________________________________________________
⚠️ Disclaimer
The Rising Wedge Pattern is a bearish reversal setup that forms when price moves within a narrowing upward channel — creating higher highs and higher lows that converge toward the top..
It often appears after an uptrend, signaling that bullish momentum is weakening and sellers may soon take control.
As price rises inside the wedge, volume usually decreases, showing fading buyer strength before a potential breakdown
____________________________________________________________
📔 Concept
• The pattern develops between two converging trendlines sloping upward.
• Each new swing high becomes smaller, showing exhaustion in buyers.
• A break below the lower wedge line confirms the bearish reversal.
• The expected move often equals the height of the wedge projected downward.
____________________________________________________________
📊 Chart Explanation
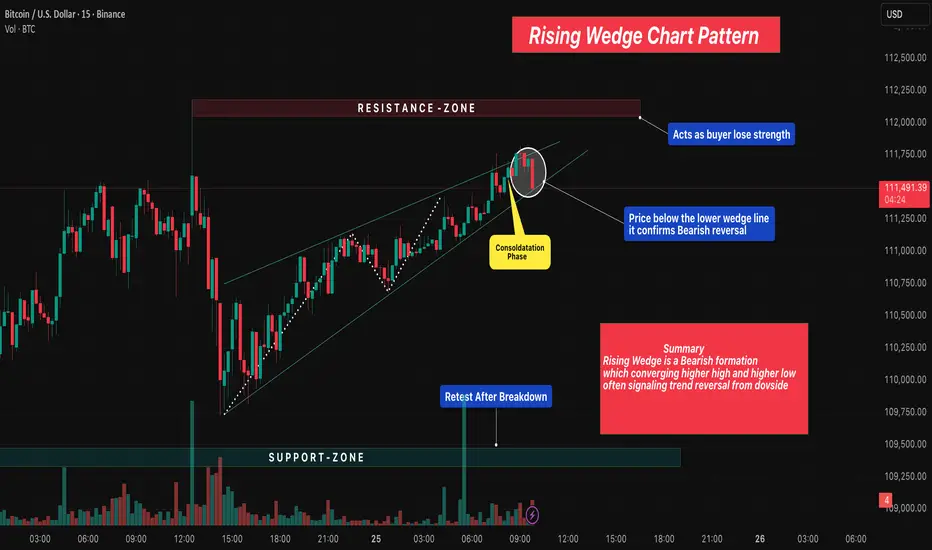
• Pattern Name → Rising Wedge Chart Pattern
• Resistance Zone → Acts as seller territory where buyers begin losing strength.
• Support Zone → Serves as the final defense; breakdown confirms bearish trend reversal.
• Consolidation Phase → Price compresses within the wedge before breakdown, showing indecision.
• Breakdown Confirmation → When price closes below the lower wedge line, it confirms bearish reversal.
• Retest After Breakdown → Price often retests the wedge from below before continuing downward.
• Summary → Rising Wedge is a bearish pattern of converging higher highs & higher lows, often signaling trend reversal from the upside.
____________________________________________________________
👀 Observation
The Rising Wedge shows weakening bullish pressure as the market climbs with smaller candles and lower volume.
Breakout traders monitor this setup for early reversal opportunities.
The most reliable setups occur near resistance zones or after extended rallies.
____________________________________________________________
💡 Conclusion
A confirmed breakdown below the wedge structure indicates sellers gaining control.
Using proper stop-loss, target projection, and volume confirmation can improve accuracy when trading this reversal formation.
____________________________________________________________
⚠️ Disclaimer
📘 For educational purposes only.
🙅 Not SEBI registered.
❌ Not a buy/sell recommendation.
🧠 Purely a learning resource.
📊 Not Financial Advice.
Declinazione di responsabilità
Le informazioni ed i contenuti pubblicati non costituiscono in alcun modo una sollecitazione ad investire o ad operare nei mercati finanziari. Non sono inoltre fornite o supportate da TradingView. Maggiori dettagli nelle Condizioni d'uso.
Declinazione di responsabilità
Le informazioni ed i contenuti pubblicati non costituiscono in alcun modo una sollecitazione ad investire o ad operare nei mercati finanziari. Non sono inoltre fornite o supportate da TradingView. Maggiori dettagli nelle Condizioni d'uso.