BTCUSD Technical Analysis – Break of Structure + Support/Resistance Strategy
🔍 Market Structure Insight
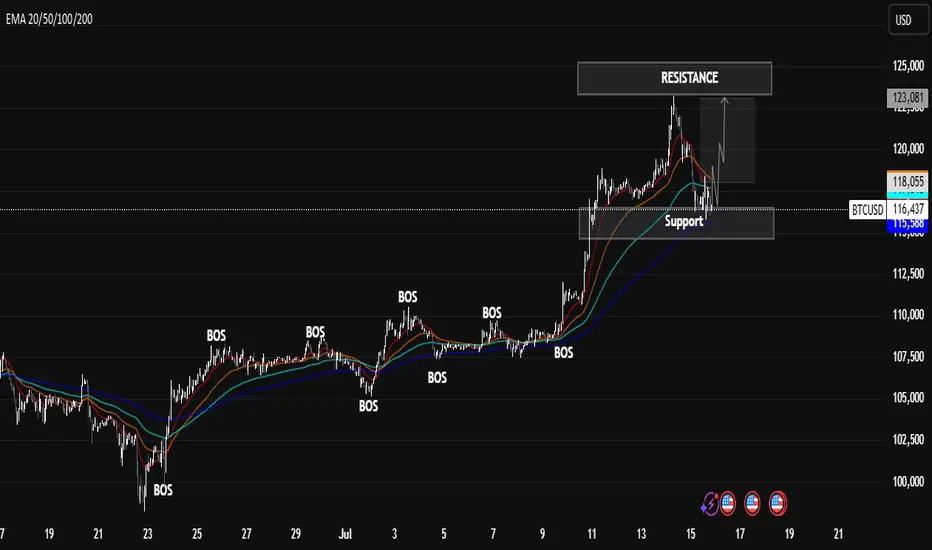
The chart clearly shows multiple Breaks of Structure (BOS) throughout the uptrend, indicating strong bullish momentum. Each BOS confirms a higher high formation and continued market strength.
📌 Key Zones
Resistance Zone: Price recently tested this level and faced rejection, indicating potential short-term selling pressure.
Support Zone: Price is currently retesting this level after a correction, showing signs of a possible bounce. It aligns well with the EMA support cluster (20–200 EMAs).
🔄 Current Price Action
After a significant impulse move to the upside, BTC is now in a corrective phase. However, the support zone is holding, and there's potential for a new bullish wave if price sustains above $115,000.
📈 Bullish Scenario
Price holds above support
EMA cluster continues to act as dynamic support
Break above $118,000 resistance could trigger the next rally toward $122,000+
🔍 Market Structure Insight
The chart clearly shows multiple Breaks of Structure (BOS) throughout the uptrend, indicating strong bullish momentum. Each BOS confirms a higher high formation and continued market strength.
📌 Key Zones
Resistance Zone: Price recently tested this level and faced rejection, indicating potential short-term selling pressure.
Support Zone: Price is currently retesting this level after a correction, showing signs of a possible bounce. It aligns well with the EMA support cluster (20–200 EMAs).
🔄 Current Price Action
After a significant impulse move to the upside, BTC is now in a corrective phase. However, the support zone is holding, and there's potential for a new bullish wave if price sustains above $115,000.
📈 Bullish Scenario
Price holds above support
EMA cluster continues to act as dynamic support
Break above $118,000 resistance could trigger the next rally toward $122,000+
Trade chiuso: obiettivo raggiunto
✅ BTC Half Target Achieved!Price reacted perfectly from our key zone — setup remains active and on track.
Monitoring for full target
Market Analyst | XAU/USD Focused
Educational Content & Technical Breakdowns
Premium VIP Signals & Market Insights
Forex Mentorship & Affiliate Opportunities
Join our Telegram t.me/Mentor_Michael033
Educational Content & Technical Breakdowns
Premium VIP Signals & Market Insights
Forex Mentorship & Affiliate Opportunities
Join our Telegram t.me/Mentor_Michael033
Declinazione di responsabilità
Le informazioni ed i contenuti pubblicati non costituiscono in alcun modo una sollecitazione ad investire o ad operare nei mercati finanziari. Non sono inoltre fornite o supportate da TradingView. Maggiori dettagli nelle Condizioni d'uso.