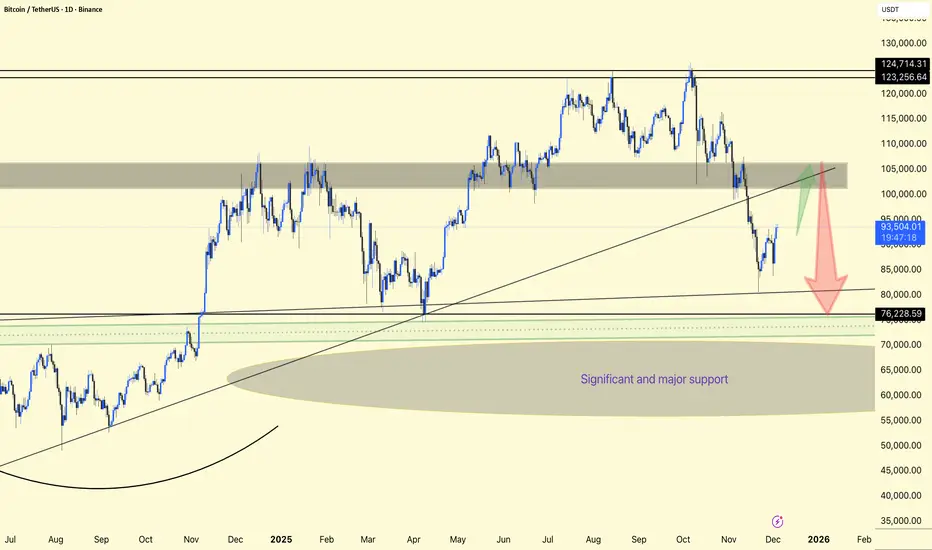
Bitcoin (BTCUSDT) is in a corrective phase within a larger bullish structure, currently bouncing off support and heading back towards a large supply zone around 102,000–106,000 USDT.
The price was previously rejected from the top resistance band of 123,000–125,000 and sold off sharply, breaking mid-range support and retesting the long-term rising trendline and horizontal support around 80,000–82,000 as a key demand area.
The chart highlights a large “critical and key support” zone from around the mid-60,000s to the low-80,000s, where multiple higher-timeframe supports and rounded bases converge, making this a key zone.
After marking support, BTC has begun a relief rally towards the broken trendline and gray resistance band near 100,000–105,000; this area could serve as a decision point where either a downward continuation or a resumption of the trend is likely.
Bull Case: A strong daily close above the gray zone and reclaimed trendline would signal continuation towards 115,000 and potentially a retest of the 123,000–125,000 highs.
Bear Case: A break below 90,000 following rejection from this resistance will likely trigger another leg down towards 80,000–82,000 and, if that fails, another deep sweep into the “Significant and Major Support” region around 60,000 before a larger accumulation base can form.
DYOR | NFA
Pubblicazioni correlate
Declinazione di responsabilità
Le informazioni e le pubblicazioni non sono intese come, e non costituiscono, consulenza o raccomandazioni finanziarie, di investimento, di trading o di altro tipo fornite o approvate da TradingView. Per ulteriori informazioni, consultare i Termini di utilizzo.