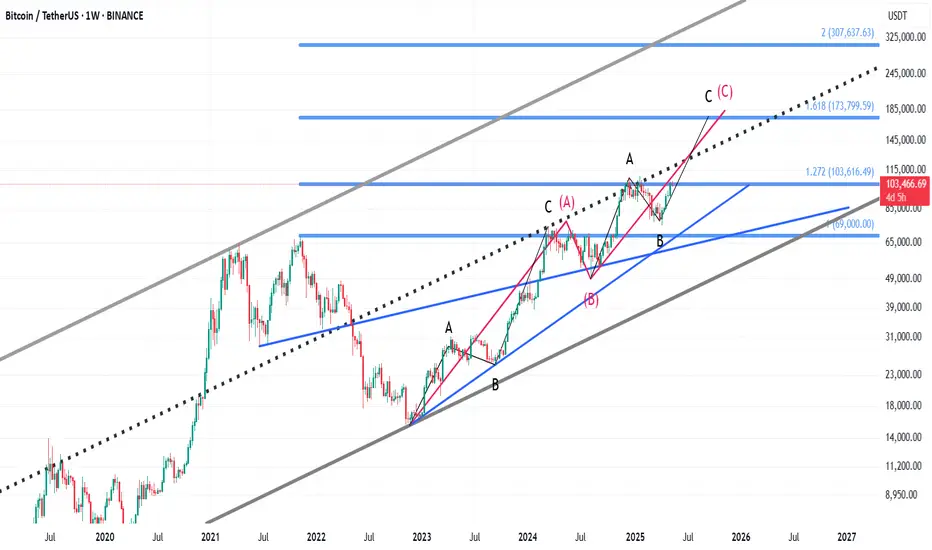
After crashing from its $69K peak (Nov 2021) to $15,476 (Nov 2022), Bitcoin has entered a bullish Elliott Wave structure, forming a classic 3-wave corrective pattern:
🔹 Wave A: Rally to $73,777 (with internal abc structure)
🔹 Wave B: Pullback to $49,000
🔹 Wave C: Currently unfolding — with a potential target at $180K
Within Wave C:
✅ Wave a: Pushed to $109K
✅ Wave b: Corrected down to 73K
73K
✅ Wave c: Now beginning and approaching a key breakout point
📌 The critical level? A daily candle close above $109K
If that happens, Bitcoin could enter its final impulsive leg toward $180K.
All technical signs point toward a major move — the structure, volume, and price action are aligned for what could be a historic breakout.
🔹 Wave A: Rally to $73,777 (with internal abc structure)
🔹 Wave B: Pullback to $49,000
🔹 Wave C: Currently unfolding — with a potential target at $180K
Within Wave C:
✅ Wave a: Pushed to $109K
✅ Wave b: Corrected down to
✅ Wave c: Now beginning and approaching a key breakout point
📌 The critical level? A daily candle close above $109K
If that happens, Bitcoin could enter its final impulsive leg toward $180K.
All technical signs point toward a major move — the structure, volume, and price action are aligned for what could be a historic breakout.
Trade attivo
Bitcoin has broken above $109,300 with a daily close, confirming entry into a new bullish wave. The next potential target lies in the $180K range. Momentum favors further upside.Declinazione di responsabilità
Le informazioni ed i contenuti pubblicati non costituiscono in alcun modo una sollecitazione ad investire o ad operare nei mercati finanziari. Non sono inoltre fornite o supportate da TradingView. Maggiori dettagli nelle Condizioni d'uso.
Declinazione di responsabilità
Le informazioni ed i contenuti pubblicati non costituiscono in alcun modo una sollecitazione ad investire o ad operare nei mercati finanziari. Non sono inoltre fornite o supportate da TradingView. Maggiori dettagli nelle Condizioni d'uso.