

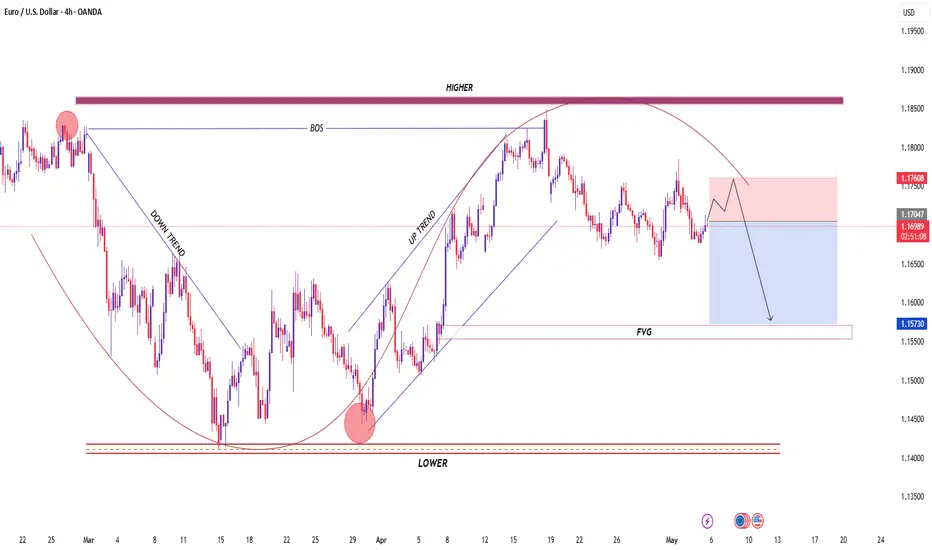
📊 EUR/USD 4H Market Structure Analysis
🧭 Overall Market Context
The chart shows a clear transition of structure:
Initial downtrend → strong bearish momentum.
Formation of a rounded bottom (accumulation) near the “LOWER” zone.
Followed by a Break of Structure (BOS) → confirms shift to bullish market structure.
Then a clean uptrend channel with higher highs and higher lows.
👉 However, price has now reached a higher-timeframe supply/resistance zone (~1.1850) and is starting to lose momentum.
🔍 Key Technical Zones
🟥 Supply / Resistance (1.1850 area)
Strong rejection zone. Price failed to break and showed distribution behavior.
🟦 Current Reaction Zone (~1.1700)
Price is consolidating here → indecision / possible continuation setup.
🟪 FVG – Fair Value Gap (~1.1570)
Imbalance below → acts as a magnet for price if bearish momentum increases.
🟫 Major Demand (Lower zone ~1.1400)
Origin of the bullish move → strong long-term support.
📉 Trend & Momentum Insight
The uptrend is weakening:
Lower highs forming after rejection.
Price no longer respecting the bullish trendline cleanly.
The curved path drawn suggests a distribution phase after the uptrend.
👉 This often leads to a corrective move or trend reversal.
🧠 Smart Money Perspective
Liquidity likely taken above previous highs near resistance.
Now market may:
Distribute positions at the top.
Move downward to rebalance inefficiencies (FVG).
🎯 Probable Scenarios
🔻 Bearish Scenario (Higher Probability)
Price fails to break above ~1.1760–1.1800.
Forms lower highs → confirms weakness.
Moves down toward:
🎯 First target: 1.1570 (FVG)
🎯 Extended target: 1.1500–1.1450 zone
✔️ This aligns with:
Rejection from supply
Weakening structure
Unfilled imbalance below
🔺 Bullish Scenario (Alternative)
Strong break and close above 1.1800–1.1850.
Retest holds → continuation upward.
🎯 Next target:
1.1900+
❗ But this scenario is less likely unless strong momentum returns.
⚠️ Key Signals to Watch
Rejection wicks near resistance → bearish confirmation
Break below minor support (~1.1670) → momentum shift
Strong bullish engulfing above resistance → invalidates bearish bias
🧾 Conclusion
📌 Market is at a critical turning point:
Structure shifted bullish, but now facing major resistance + exhaustion.
Short-term bias: bearish correction toward imbalance zone.
👉 Best approach:
Look for sell setups on pullbacks unless resistance is clearly broken.
🧭 Overall Market Context
The chart shows a clear transition of structure:
Initial downtrend → strong bearish momentum.
Formation of a rounded bottom (accumulation) near the “LOWER” zone.
Followed by a Break of Structure (BOS) → confirms shift to bullish market structure.
Then a clean uptrend channel with higher highs and higher lows.
👉 However, price has now reached a higher-timeframe supply/resistance zone (~1.1850) and is starting to lose momentum.
🔍 Key Technical Zones
🟥 Supply / Resistance (1.1850 area)
Strong rejection zone. Price failed to break and showed distribution behavior.
🟦 Current Reaction Zone (~1.1700)
Price is consolidating here → indecision / possible continuation setup.
🟪 FVG – Fair Value Gap (~1.1570)
Imbalance below → acts as a magnet for price if bearish momentum increases.
🟫 Major Demand (Lower zone ~1.1400)
Origin of the bullish move → strong long-term support.
📉 Trend & Momentum Insight
The uptrend is weakening:
Lower highs forming after rejection.
Price no longer respecting the bullish trendline cleanly.
The curved path drawn suggests a distribution phase after the uptrend.
👉 This often leads to a corrective move or trend reversal.
🧠 Smart Money Perspective
Liquidity likely taken above previous highs near resistance.
Now market may:
Distribute positions at the top.
Move downward to rebalance inefficiencies (FVG).
🎯 Probable Scenarios
🔻 Bearish Scenario (Higher Probability)
Price fails to break above ~1.1760–1.1800.
Forms lower highs → confirms weakness.
Moves down toward:
🎯 First target: 1.1570 (FVG)
🎯 Extended target: 1.1500–1.1450 zone
✔️ This aligns with:
Rejection from supply
Weakening structure
Unfilled imbalance below
🔺 Bullish Scenario (Alternative)
Strong break and close above 1.1800–1.1850.
Retest holds → continuation upward.
🎯 Next target:
1.1900+
❗ But this scenario is less likely unless strong momentum returns.
⚠️ Key Signals to Watch
Rejection wicks near resistance → bearish confirmation
Break below minor support (~1.1670) → momentum shift
Strong bullish engulfing above resistance → invalidates bearish bias
🧾 Conclusion
📌 Market is at a critical turning point:
Structure shifted bullish, but now facing major resistance + exhaustion.
Short-term bias: bearish correction toward imbalance zone.
👉 Best approach:
Look for sell setups on pullbacks unless resistance is clearly broken.

✦ MARKET STRATEGY SIGNALS ✦ 📊
Smart Money • Price Action • Precision • good entries
📲 Join Telegram: t.me/marketstrategyentry
Smart Money • Price Action • Precision • good entries
📲 Join Telegram: t.me/marketstrategyentry
Pubblicazioni correlate
Declinazione di responsabilità
Le informazioni e le pubblicazioni non sono intese come, e non costituiscono, consulenza o raccomandazioni finanziarie, di investimento, di trading o di altro tipo fornite o approvate da TradingView. Per ulteriori informazioni, consultare i Termini di utilizzo.
✦ MARKET STRATEGY SIGNALS ✦ 📊
Smart Money • Price Action • Precision • good entries
📲 Join Telegram: t.me/marketstrategyentry
Smart Money • Price Action • Precision • good entries
📲 Join Telegram: t.me/marketstrategyentry
Pubblicazioni correlate
Declinazione di responsabilità
Le informazioni e le pubblicazioni non sono intese come, e non costituiscono, consulenza o raccomandazioni finanziarie, di investimento, di trading o di altro tipo fornite o approvate da TradingView. Per ulteriori informazioni, consultare i Termini di utilizzo.