Following its Q3 report with EPS of $12.25 (above expectations) and ~20% revenue growth,  GS shares held firm and began to recover.
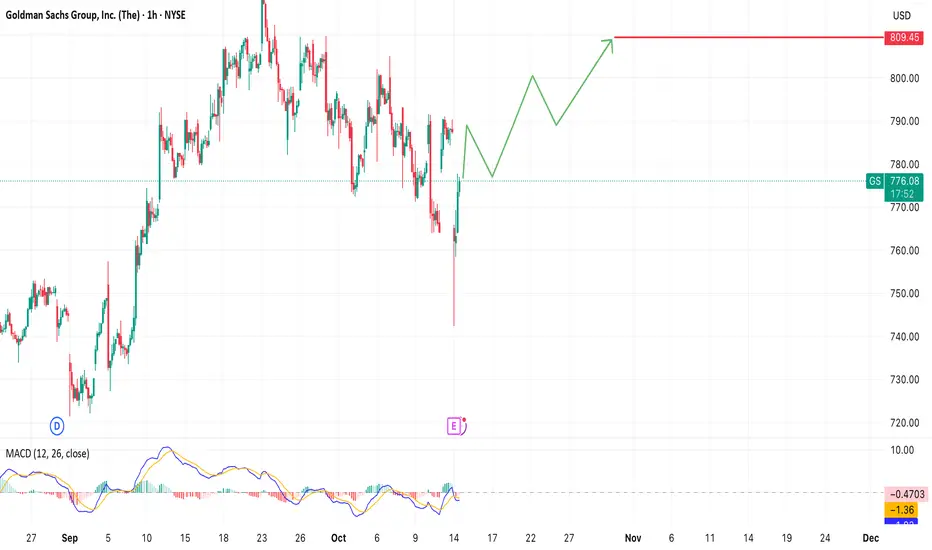
Key levels:
Support: $760 – 765
Resistance / Target: $809 — previous profit-taking zone
MACD is showing signs of a bullish reversal
Price structure suggests a potential short-term upward zigzag pattern
A breakout above $780 could confirm momentum toward the $809 target.
Fundamentally, GS remains one of the strongest names in the banking sector, with M&A and investment banking activity gaining traction again.
Declinazione di responsabilità
Le informazioni e le pubblicazioni non sono intese come, e non costituiscono, consulenza o raccomandazioni finanziarie, di investimento, di trading o di altro tipo fornite o approvate da TradingView. Per ulteriori informazioni, consultare i Termini di utilizzo.
Declinazione di responsabilità
Le informazioni e le pubblicazioni non sono intese come, e non costituiscono, consulenza o raccomandazioni finanziarie, di investimento, di trading o di altro tipo fornite o approvate da TradingView. Per ulteriori informazioni, consultare i Termini di utilizzo.