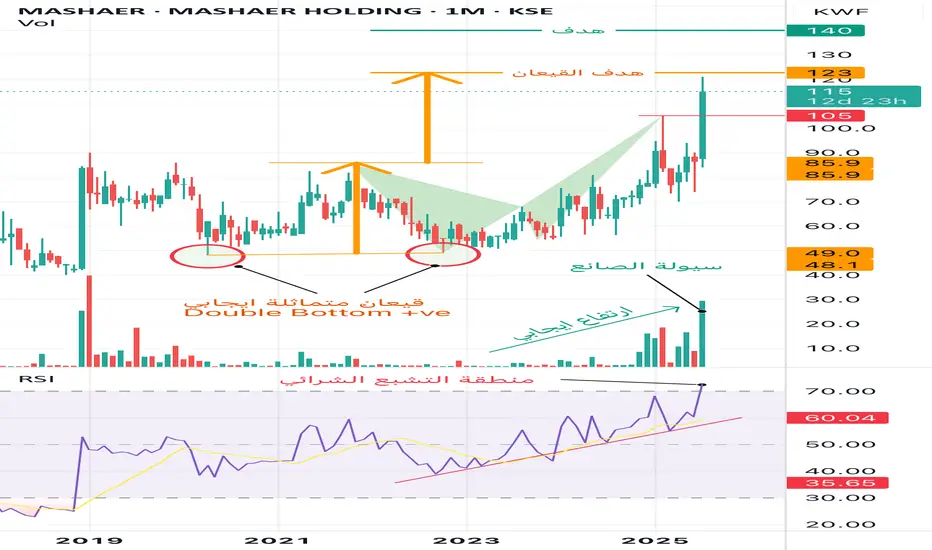
The stock maintains a clear upward trend, with no current negative technical signals. This suggests a high probability of continued price appreciation toward higher target levels.
Detailed Analysis:
1. Chart Pattern – Double Bottom:
• A positive symmetrical double bottom has been completed, which is one of the strongest bullish reversal patterns.
• The measured target from the pattern (based on the neckline breakout) projects a price level of 123 KWF.
• The current price is 115 KWF, indicating more room for upside.
2. Volume and Liquidity:
• A noticeable surge in trading volume during the latest monthly candle reflects strong institutional inflow.
• This increase is often referred to as “smart money” activity, suggesting accumulation by major players.
3. RSI – Relative Strength Index:
• The RSI has moved into the overbought territory (above 70), signaling that the stock is potentially overextended in the short term.
• However, there are no signs of bearish divergence or a clear reversal signal yet.
• The RSI trend has been consistently rising for several months, supporting the ongoing bullish momentum.
Summary:
The stock remains technically bullish, supported by a valid breakout pattern, rising volume, and strong momentum indicators. Despite the RSI entering overbought levels, the lack of any confirmed reversal signal means the uptrend remains intact.
Price Targets:
• Pattern Target (Double Bottom): 123 KWF
• Strategic Resistance / Long-Term Target: 140 KWF
Declinazione di responsabilità
Le informazioni ed i contenuti pubblicati non costituiscono in alcun modo una sollecitazione ad investire o ad operare nei mercati finanziari. Non sono inoltre fornite o supportate da TradingView. Maggiori dettagli nelle Condizioni d'uso.
Declinazione di responsabilità
Le informazioni ed i contenuti pubblicati non costituiscono in alcun modo una sollecitazione ad investire o ad operare nei mercati finanziari. Non sono inoltre fornite o supportate da TradingView. Maggiori dettagli nelle Condizioni d'uso.