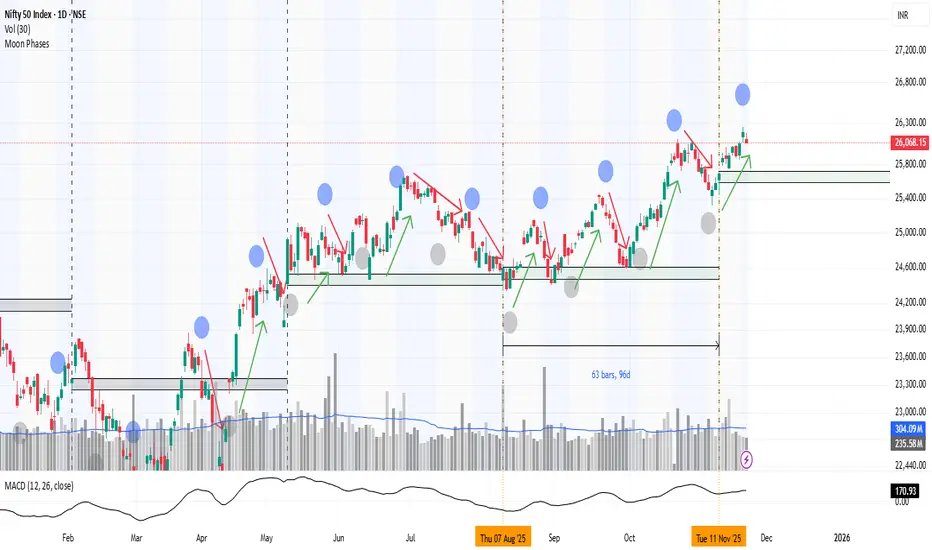
Believe it or not, the Moon phase does its work. From New Moon to Full Moon, this up and down dance goes on in the market. It goes on and we are not able to pay attention to it, but it works. You will see that the market falls from New Moon and after Full Moon, the market starts moving upwards. It is difficult to say, but its effect starts becoming visible within plus minus 3 days.
And along with this, let me tell you that the high of the candle of 11th November was around 25715 and the low was around 25450, so this is the area of support(LOC).
And also remember that if the market can hold this support zone till 28th November (Ashtami Tithi), then it will be a very good thing. If the market breaks this support before the situation, then you may see even bigger blood bath in the market.
Declinazione di responsabilità
Le informazioni e le pubblicazioni non sono intese come, e non costituiscono, consulenza o raccomandazioni finanziarie, di investimento, di trading o di altro tipo fornite o approvate da TradingView. Per ulteriori informazioni, consultare i Termini di utilizzo.
Declinazione di responsabilità
Le informazioni e le pubblicazioni non sono intese come, e non costituiscono, consulenza o raccomandazioni finanziarie, di investimento, di trading o di altro tipo fornite o approvate da TradingView. Per ulteriori informazioni, consultare i Termini di utilizzo.