📈 NIFTY 50 – At the Doorstep of ATH Resistance | Make of Break Levels
🧠 Educational Analysis
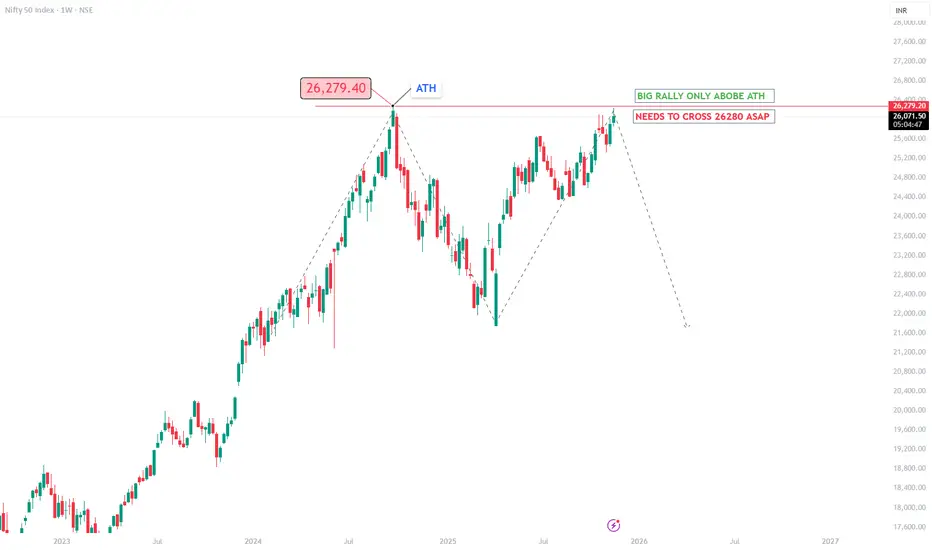
NIFTY 50 is once again testing its All-Time High (ATH) zone around 26,279.
This level has acted as a major ceiling in the past, triggering a large correction previously.
Currently, price has retraced back into this crucial level after forming a higher structural swing, showing significant buying strength.
However, no major breakout can be confirmed until NIFTY closes decisively above 26,280.
This chart serves as a clear example of how markets behave around psychological levels and previous ATH zones.
🔍 Technical Highlights
26,279 – All-Time High (ATH) & will act as Strong resistance zone where sellers previously pushed price down sharply.
Big Rally can begin only above ATH, as marked on the chart.
Dotted Path Downside Demonstrates possible retracement path if NIFTY fails to break ATH.
📘 Educational Purpose
This chart is shared only for educational analysis, to illustrate:
How ATH zones act as major decision points
How markets create two-sided scenarios (breakout vs. rejection)
How higher-timeframe structures influence trend continuation
Learners can use this as a real-world study of structure, ATH behavior, and confirmation setups.
⚠️ Disclaimer
This analysis is not financial advice.
All observations are shared purely for technical education and learning purposes.
Always do your own research or consult a financial advisor before making any trading decisions.
🧠 Educational Analysis
NIFTY 50 is once again testing its All-Time High (ATH) zone around 26,279.
This level has acted as a major ceiling in the past, triggering a large correction previously.
Currently, price has retraced back into this crucial level after forming a higher structural swing, showing significant buying strength.
However, no major breakout can be confirmed until NIFTY closes decisively above 26,280.
This chart serves as a clear example of how markets behave around psychological levels and previous ATH zones.
🔍 Technical Highlights
26,279 – All-Time High (ATH) & will act as Strong resistance zone where sellers previously pushed price down sharply.
Big Rally can begin only above ATH, as marked on the chart.
Dotted Path Downside Demonstrates possible retracement path if NIFTY fails to break ATH.
📘 Educational Purpose
This chart is shared only for educational analysis, to illustrate:
How ATH zones act as major decision points
How markets create two-sided scenarios (breakout vs. rejection)
How higher-timeframe structures influence trend continuation
Learners can use this as a real-world study of structure, ATH behavior, and confirmation setups.
⚠️ Disclaimer
This analysis is not financial advice.
All observations are shared purely for technical education and learning purposes.
Always do your own research or consult a financial advisor before making any trading decisions.
Declinazione di responsabilità
Le informazioni e le pubblicazioni non sono intese come, e non costituiscono, consulenza o raccomandazioni finanziarie, di investimento, di trading o di altro tipo fornite o approvate da TradingView. Per ulteriori informazioni, consultare i Termini di utilizzo.
Declinazione di responsabilità
Le informazioni e le pubblicazioni non sono intese come, e non costituiscono, consulenza o raccomandazioni finanziarie, di investimento, di trading o di altro tipo fornite o approvate da TradingView. Per ulteriori informazioni, consultare i Termini di utilizzo.