📘 Trade Summary
Pair: NVDA (NASDAQ)
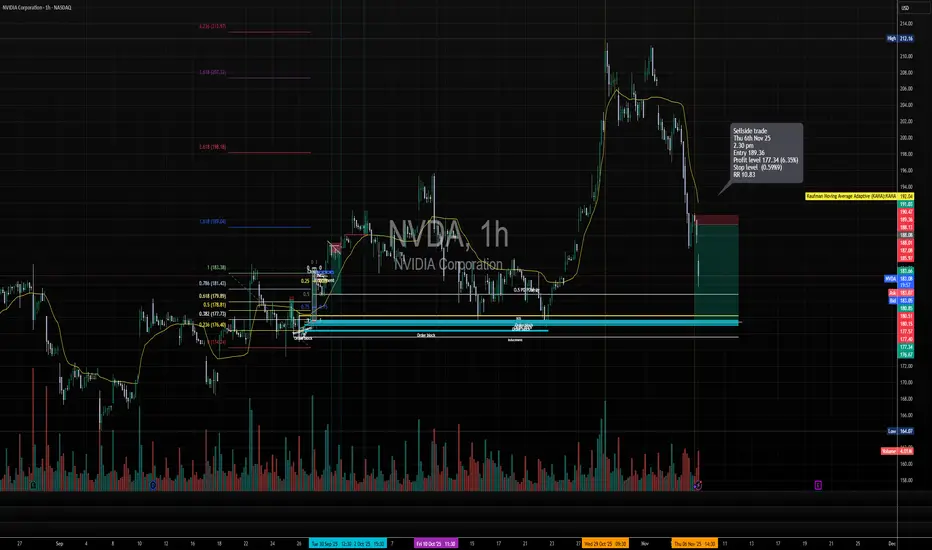
Direction: Sell-side Trade
Date: Thu 6 Nov 25
Time: 2:30 pm
Entry: 189.36
Profit Level: 177.34 (+6.35%)
Stop Level: 189.99 (–0.59%)
Risk-Reward (RR): 10.83

🧩 Technical Context
Price Structure: Market rejected near the previous swing high (~$197–$200 region) after failing to sustain above the 1.618 extension level.
Fibonacci Context: Retracement zones from 0.382 – 0.786 aligned with prior accumulation zones, showing resistance at 0.618 (≈ 179.89) and 0.786 (≈ 181.43).
Order Block Alignment: Two visible order blocks (highlighted in blue) show prior demand zones — price is expected to retrace into these for potential take-profit liquidity.
Volume Spike: Noticeable volume at the rejection candle near $190–$191 indicates institutional sell orders stepping in.
EMA Context: Price fell below the Kaufman Adaptive Moving Average (KAMA), confirming a short-term shift to bearish momentum.
🧠 Trade Narrative
This short setup capitalises on:
A failed breakout at the prior liquidity high (~$197),
Break of structure (BOS) confirming downside shift, and
Entry at the retest of a supply zone near $189.
Targeting liquidity sweep of prior accumulation zone around $177, where confluence with the lower order block exists.
Pair: NVDA (NASDAQ)
Direction: Sell-side Trade
Date: Thu 6 Nov 25
Time: 2:30 pm
Entry: 189.36
Profit Level: 177.34 (+6.35%)
Stop Level: 189.99 (–0.59%)
Risk-Reward (RR): 10.83
🧩 Technical Context
Price Structure: Market rejected near the previous swing high (~$197–$200 region) after failing to sustain above the 1.618 extension level.
Fibonacci Context: Retracement zones from 0.382 – 0.786 aligned with prior accumulation zones, showing resistance at 0.618 (≈ 179.89) and 0.786 (≈ 181.43).
Order Block Alignment: Two visible order blocks (highlighted in blue) show prior demand zones — price is expected to retrace into these for potential take-profit liquidity.
Volume Spike: Noticeable volume at the rejection candle near $190–$191 indicates institutional sell orders stepping in.
EMA Context: Price fell below the Kaufman Adaptive Moving Average (KAMA), confirming a short-term shift to bearish momentum.
🧠 Trade Narrative
This short setup capitalises on:
A failed breakout at the prior liquidity high (~$197),
Break of structure (BOS) confirming downside shift, and
Entry at the retest of a supply zone near $189.
Targeting liquidity sweep of prior accumulation zone around $177, where confluence with the lower order block exists.
Trade attivo
Stop level moved (3.34%)
Trade chiuso: obiettivo raggiunto
Declinazione di responsabilità
Le informazioni e le pubblicazioni non sono intese come, e non costituiscono, consulenza o raccomandazioni finanziarie, di investimento, di trading o di altro tipo fornite o approvate da TradingView. Per ulteriori informazioni, consultare i Termini di utilizzo.
Declinazione di responsabilità
Le informazioni e le pubblicazioni non sono intese come, e non costituiscono, consulenza o raccomandazioni finanziarie, di investimento, di trading o di altro tipo fornite o approvate da TradingView. Per ulteriori informazioni, consultare i Termini di utilizzo.