🧠 Technical Analysis – 1H + 15M Chart
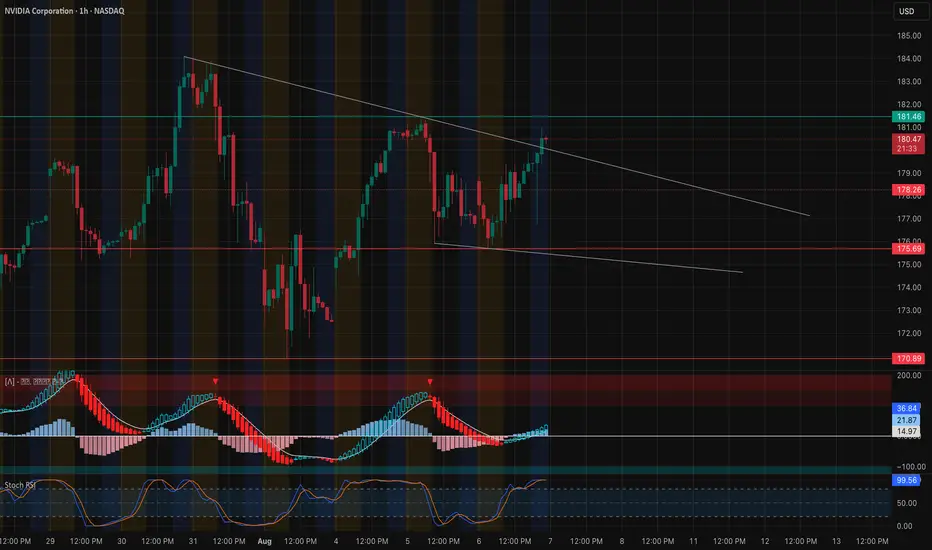
NVDA is testing the upper bound of a symmetrical triangle on the 1-hour chart — a critical spot that could either break for continuation or reject back into the wedge.
* Trendline resistance from previous highs is pressing NVDA around 180.80–181.50.
* Stochastic RSI is overheated (>99), suggesting a potential pullback or fakeout before true breakout strength.
* MACD is crossing bullish with increasing histogram momentum — short-term buyers are stepping in.
On the 15-minute chart, we see:
* Tight coil forming near 181.00.
* Minor resistance at 181.46 from previous rejection.
* A bullish breakout above 182.00 on volume would confirm a short-term rally.
⚠️ Keep an eye for a potential fakeout above trendline and reversal back below 179.70 — a CHoCH could trap late bulls.
💥 GEX + Options Sentiment (Based on 1H Chart)

* GEX Map shows massive resistance forming around 182.5–185, with:
* 57.12% Call Wall at 182.5
* 51.68% Call Wall at 185
* Gamma is heavily concentrated just above current price — strong dealer hedging could cap upside moves if flow doesn't increase.
* Support Zones:
* 175 → Put support and HVL level
* 172.5 → Cluster of downside GEX risk (-7.23%)
* IVR is at 19.3 (low), with Call flow only at 3.4% — suggesting institutions are not aggressively chasing upside here.
🎯 Trade Scenarios
Bullish Breakout Setup
* ✅ Entry: Above 182.00 breakout
* 🎯 Target: 184.20 → 185.50
* 🛑 Stop: Below 179.50 or re-entry inside triangle
Bearish Rejection Setup
* 🔻 Entry: Rejection from 181.50–182.00 zone
* 🎯 Target: 178.20 → 175
* 🛑 Stop: Above 182.30
My Thoughts: NVDA is at a decision point — either break out and squeeze through GEX walls or get trapped and fade to lower support zones. Volume and reaction at 182 will be key. This is a high-risk area for chasers — ideal zone for scalpers and short-term breakout traders with tight stops.
Disclaimer: This analysis is for educational purposes only and does not constitute financial advice. Always do your own research and manage your risk accordingly.
NVDA is testing the upper bound of a symmetrical triangle on the 1-hour chart — a critical spot that could either break for continuation or reject back into the wedge.
* Trendline resistance from previous highs is pressing NVDA around 180.80–181.50.
* Stochastic RSI is overheated (>99), suggesting a potential pullback or fakeout before true breakout strength.
* MACD is crossing bullish with increasing histogram momentum — short-term buyers are stepping in.
On the 15-minute chart, we see:
* Tight coil forming near 181.00.
* Minor resistance at 181.46 from previous rejection.
* A bullish breakout above 182.00 on volume would confirm a short-term rally.
⚠️ Keep an eye for a potential fakeout above trendline and reversal back below 179.70 — a CHoCH could trap late bulls.
💥 GEX + Options Sentiment (Based on 1H Chart)
* GEX Map shows massive resistance forming around 182.5–185, with:
* 57.12% Call Wall at 182.5
* 51.68% Call Wall at 185
* Gamma is heavily concentrated just above current price — strong dealer hedging could cap upside moves if flow doesn't increase.
* Support Zones:
* 175 → Put support and HVL level
* 172.5 → Cluster of downside GEX risk (-7.23%)
* IVR is at 19.3 (low), with Call flow only at 3.4% — suggesting institutions are not aggressively chasing upside here.
🎯 Trade Scenarios
Bullish Breakout Setup
* ✅ Entry: Above 182.00 breakout
* 🎯 Target: 184.20 → 185.50
* 🛑 Stop: Below 179.50 or re-entry inside triangle
Bearish Rejection Setup
* 🔻 Entry: Rejection from 181.50–182.00 zone
* 🎯 Target: 178.20 → 175
* 🛑 Stop: Above 182.30
My Thoughts: NVDA is at a decision point — either break out and squeeze through GEX walls or get trapped and fade to lower support zones. Volume and reaction at 182 will be key. This is a high-risk area for chasers — ideal zone for scalpers and short-term breakout traders with tight stops.
Disclaimer: This analysis is for educational purposes only and does not constitute financial advice. Always do your own research and manage your risk accordingly.
Declinazione di responsabilità
Le informazioni e le pubblicazioni non sono intese come, e non costituiscono, consulenza o raccomandazioni finanziarie, di investimento, di trading o di altro tipo fornite o approvate da TradingView. Per ulteriori informazioni, consultare i Termini di utilizzo.
Declinazione di responsabilità
Le informazioni e le pubblicazioni non sono intese come, e non costituiscono, consulenza o raccomandazioni finanziarie, di investimento, di trading o di altro tipo fornite o approvate da TradingView. Per ulteriori informazioni, consultare i Termini di utilizzo.