Technical analysis of NVIDIA Corporation
ON DAILY BASIS
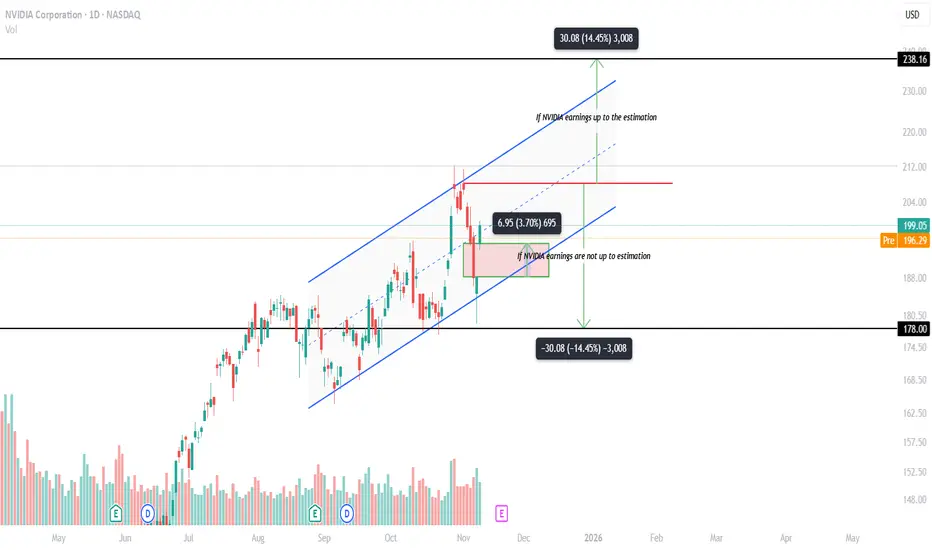
- As we seen on above chart, it is in Daily basis.
- It shows upward trend.
- On between 7th November,2025 & 10th November,2025 Liquidity gap is formed it may fill the gap ($6.95 or 3.70%) on 11th November,2025 after that it will go up to $208 (The line which is in RED color) till the earnings call.
- The price of $208 is taken as Support line as well as Resistance line because of the closing candle is near price to the 52-week high.
- If NVIDIA earnings are beat the estimation of markets, then upward trend continue till the price reaches $238.16 over the time from the Support line.
- If NVIDIA earnings are not beat the estimation of market, then the stock price will fall up to $178 over the time from the Resistance line.
- As per Price & volume analysis of daily basis, Volumes are quite not stable because of speculation of news created panic in markets it may continue this week until the earning day come.
ON WEEKLY BASIS
- As we seen in above chart, It is in Weekly chart.
- It shows Upward trend.
- The weekly chart tells us the volatility of stock during the last week. It will be continue till the NVIDIA post the results.
- Last week the candle form Bearish Engulfing due to the speculations of AI boom and Michael burry shorting bets on NVIDIA even though the speculation of news is not confirmed about AI boom and shorting bets.
- The market participants are panicked that’s why the stock has volatility during last week.
Even though it has lot of potential growth in AI but the speculations of AI Boom, Shorting bets and fear of recession in US markets will lead to slow down the stock growth.
- As per Price & volume analysis of weekly basis, Volumes are so stable so it may not be the disturbance for Upward trend until the earning day come.
ON DAILY BASIS
- As we seen on above chart, it is in Daily basis.
- It shows upward trend.
- On between 7th November,2025 & 10th November,2025 Liquidity gap is formed it may fill the gap ($6.95 or 3.70%) on 11th November,2025 after that it will go up to $208 (The line which is in RED color) till the earnings call.
- The price of $208 is taken as Support line as well as Resistance line because of the closing candle is near price to the 52-week high.
- If NVIDIA earnings are beat the estimation of markets, then upward trend continue till the price reaches $238.16 over the time from the Support line.
- If NVIDIA earnings are not beat the estimation of market, then the stock price will fall up to $178 over the time from the Resistance line.
- As per Price & volume analysis of daily basis, Volumes are quite not stable because of speculation of news created panic in markets it may continue this week until the earning day come.
ON WEEKLY BASIS
- As we seen in above chart, It is in Weekly chart.
- It shows Upward trend.
- The weekly chart tells us the volatility of stock during the last week. It will be continue till the NVIDIA post the results.
- Last week the candle form Bearish Engulfing due to the speculations of AI boom and Michael burry shorting bets on NVIDIA even though the speculation of news is not confirmed about AI boom and shorting bets.
- The market participants are panicked that’s why the stock has volatility during last week.
Even though it has lot of potential growth in AI but the speculations of AI Boom, Shorting bets and fear of recession in US markets will lead to slow down the stock growth.
- As per Price & volume analysis of weekly basis, Volumes are so stable so it may not be the disturbance for Upward trend until the earning day come.
Declinazione di responsabilità
The information and publications are not meant to be, and do not constitute, financial, investment, trading, or other types of advice or recommendations supplied or endorsed by TradingView. Read more in the Terms of Use.
Declinazione di responsabilità
The information and publications are not meant to be, and do not constitute, financial, investment, trading, or other types of advice or recommendations supplied or endorsed by TradingView. Read more in the Terms of Use.