1. Pattern Analysis
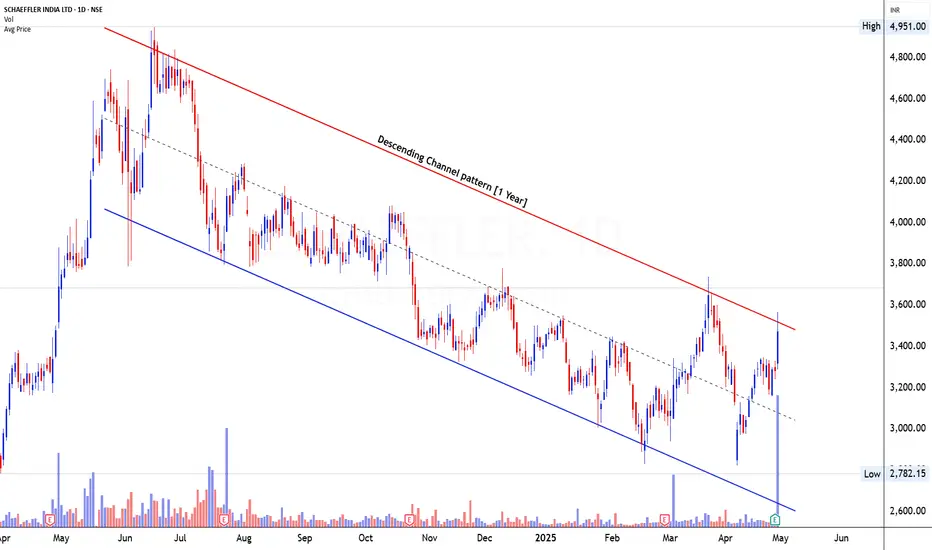
Schaeffler India Ltd has been consolidating within a well-defined Descending Channel Pattern over the past 1 year, with the price consistently respecting both the upper red resistance trendline and lower blue support trendline. This bearish structure indicates a clear trend of lower highs and lower lows during this period. However, the price action has recently approached the channel’s resistance zone with strong momentum, hinting at a potential breakout or reversal scenario. This 1-year channel qualifies as a tradable pattern in the Mr. Chartist methodology.
2. Volume Analysis
Volume analysis reveals a distinct shift in sentiment. After a prolonged period of low to moderate volume during declines and consolidation, the most recent sessions have witnessed a dramatic rise in volume, particularly on bullish candles. This surge in volume near the channel’s upper boundary strongly indicates accumulation and institutional participation. The large bullish candle formed with above-average volume suggests increased conviction behind the move, which is crucial for a valid breakout scenario.
3. Candlestick or Price Analysis
From a price structure standpoint, Schaeffler has formed a series of strong bullish candles leading into the current resistance zone around ₹3,500–₹3,600. The most recent candle is wide-ranged with a strong closing near the day’s high, suggesting the bulls are in control. Importantly, the move off the lower blue support trendline is sharp and directional, breaking minor internal resistances within the channel. The strength of this impulsive leg increases the likelihood of a breakout attempt through the red descending trendline, which would mark a significant trend reversal.
4. Validation of Signal
Although the breakout hasn’t yet confirmed with a close above the upper channel line, the signal is nearing validation. The sharp move upward, paired with a spike in volume and favorable candlestick behavior, aligns with early breakout characteristics. A confirmed daily close above ₹3,600, followed by bullish follow-through, would validate the breakout from the descending channel pattern. Until then, this setup should be watched closely for confirmation, especially if the price consolidates tightly below resistance before a breakout.
5. Tradable Points Determination
Entry Point Determination
A potential entry could be initiated upon a confirmed breakout above the ₹3,600 level, preferably supported by another strong bullish candle on volume. Conservative traders may wait for a retest of the breakout zone post-breakout before entering.
Target Point Determination
The height of the descending channel ranges approximately from ₹3,600 at the top to ₹2,800 at the bottom, giving us a height of ₹800. Adding this height to the breakout level of ₹3,600 gives a measured target of around ₹4,400 in the coming weeks or months if the trend sustains.
Stop Loss Placement and Trailing SL Follow-Up
A suitable stop loss could be placed below ₹3,300, near the recent swing low before the breakout leg. Once the breakout is confirmed and price sustains above ₹3,700, the SL can be moved up to the breakout point at ₹3,600. Subsequent trailing can be done by following swing lows or using the 21-day EMA as a dynamic stop.
Learn Today for Better Tomorrow
Declinazione di responsabilità
Le informazioni e le pubblicazioni non sono intese come, e non costituiscono, consulenza o raccomandazioni finanziarie, di investimento, di trading o di altro tipo fornite o approvate da TradingView. Per ulteriori informazioni, consultare i Termini di utilizzo.