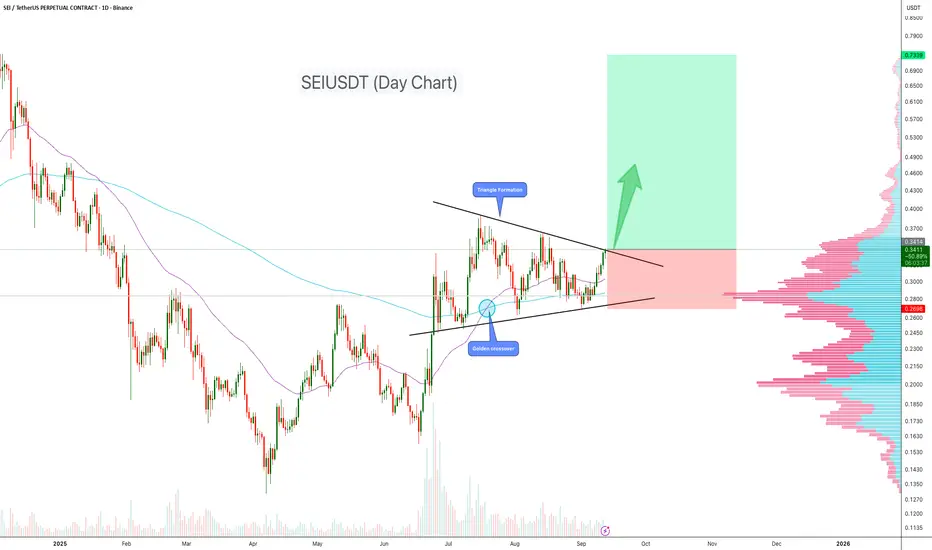
SEI has been consolidating within a symmetrical triangle on the daily chart. After weeks of compression, price is now testing the upper resistance trendline. A breakout could trigger strong upside momentum.
Key Points
- Triangle Pattern: Price has formed higher lows against flat resistance, signaling pressure building for a breakout.
- Golden Crossover: The 50 EMA recently crossed above the 200 EMA, strengthening the bullish outlook.
-Volume Profile: Key accumulation zone around $0.28 acting as strong support.
- Upside Potential: A confirmed breakout above $0.345 could send SEI toward $0.50–$0.65.
Trading Plan
Entry Zone: On breakout confirmation above $3.45
Target (TP): $0.50 – $0.650 initially, higher if momentum continues.
Stop-Loss (SL): Below $0.27 support.
Cheers
Hexa
🚀Telegram : t.me/hexatrades
🌐Website: hexatrades.io/
🗣️Twitter(X): twitter.com/HexaTrades
🌐Website: hexatrades.io/
🗣️Twitter(X): twitter.com/HexaTrades
Pubblicazioni correlate
Declinazione di responsabilità
Le informazioni e le pubblicazioni non sono intese come, e non costituiscono, consulenza o raccomandazioni finanziarie, di investimento, di trading o di altro tipo fornite o approvate da TradingView. Per ulteriori informazioni, consultare i Termini di utilizzo.