The daily chart of SOLUSDT Perpetual Futures (MEXC) is currently showing signs of a potential reversal setup, but confirmation is key before taking a long position.
🔍 Chart Overview:
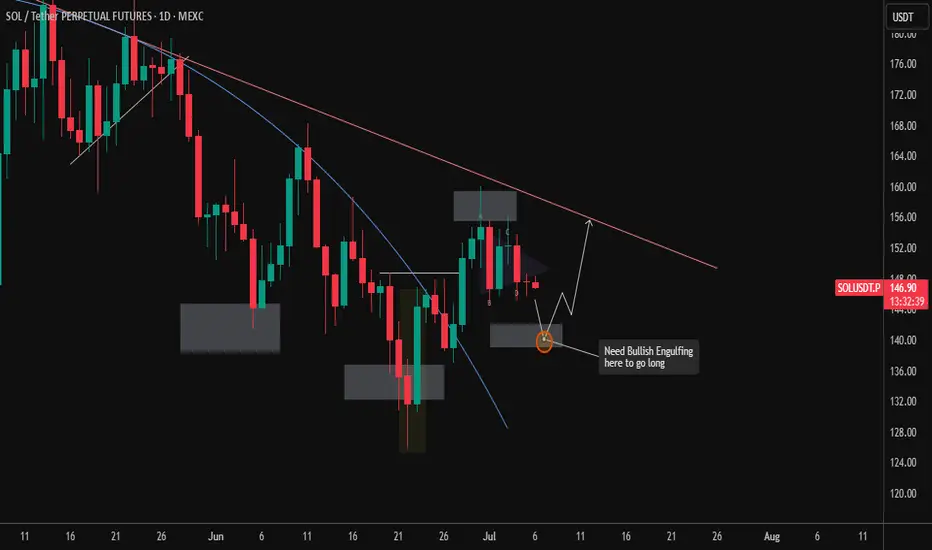
Price action is in a clear downtrend, with lower highs forming consistently, capped by a descending trendline.
We’ve recently seen a pullback after a failed breakout near the $152–$154 region.
📌 Key Zone to Watch:
A demand zone around $137–$140 is marked, which previously acted as a springboard for bullish movement.
There's a confluence of this demand zone with the wedge breakout retest area.
📈 Trade Setup & Plan:
The chart notes: "Need Bullish Engulfing here to go long".
This implies a waiting strategy: look for a strong bullish engulfing candle at the $137–$140 zone before entering a long position.
If confirmed, price could rally back toward the descending trendline near $150–$154, which aligns with the prior resistance level.
⚠️ Invalidation:
A daily close below $135 would invalidate the bullish setup and likely trigger continuation toward $128–$130 support area.
📊 Summary:
Bias: Cautiously Bullish (Waiting for confirmation)
Entry Trigger: Bullish engulfing candle at $137–$140
Target: $152–$154
Invalidation Level: Below $135
Patience is key here. Let the price come to you and confirm intent before jumping in.
🔍 Chart Overview:
Price action is in a clear downtrend, with lower highs forming consistently, capped by a descending trendline.
We’ve recently seen a pullback after a failed breakout near the $152–$154 region.
📌 Key Zone to Watch:
A demand zone around $137–$140 is marked, which previously acted as a springboard for bullish movement.
There's a confluence of this demand zone with the wedge breakout retest area.
📈 Trade Setup & Plan:
The chart notes: "Need Bullish Engulfing here to go long".
This implies a waiting strategy: look for a strong bullish engulfing candle at the $137–$140 zone before entering a long position.
If confirmed, price could rally back toward the descending trendline near $150–$154, which aligns with the prior resistance level.
⚠️ Invalidation:
A daily close below $135 would invalidate the bullish setup and likely trigger continuation toward $128–$130 support area.
📊 Summary:
Bias: Cautiously Bullish (Waiting for confirmation)
Entry Trigger: Bullish engulfing candle at $137–$140
Target: $152–$154
Invalidation Level: Below $135
Patience is key here. Let the price come to you and confirm intent before jumping in.
Declinazione di responsabilità
Le informazioni ed i contenuti pubblicati non costituiscono in alcun modo una sollecitazione ad investire o ad operare nei mercati finanziari. Non sono inoltre fornite o supportate da TradingView. Maggiori dettagli nelle Condizioni d'uso.
Declinazione di responsabilità
Le informazioni ed i contenuti pubblicati non costituiscono in alcun modo una sollecitazione ad investire o ad operare nei mercati finanziari. Non sono inoltre fornite o supportate da TradingView. Maggiori dettagli nelle Condizioni d'uso.