This isn't the first time we present you this chart, in fact from time to time (usually on a quarterly basis) we like to bring this forward with some adjustments in order to help us maintain a long-term perspective.
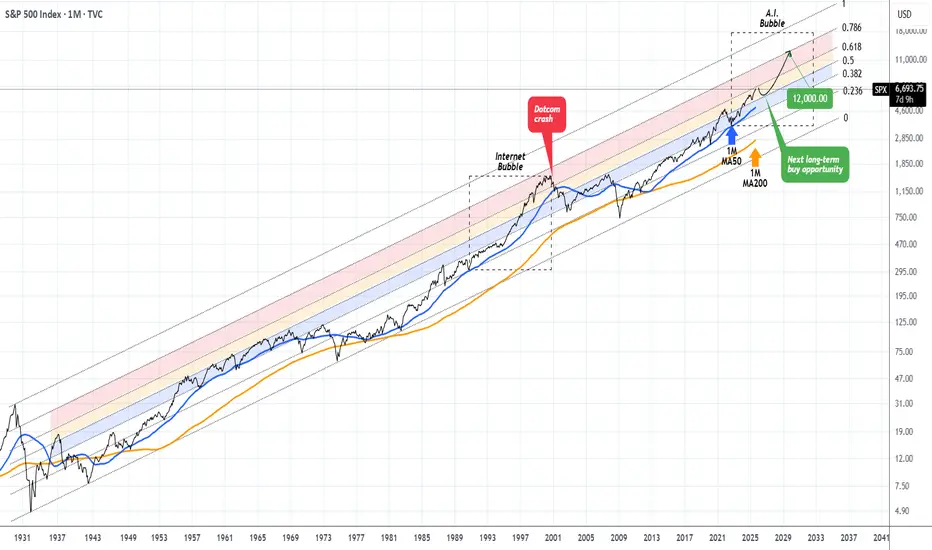
And that technically shows the S&P500 index (SPX) trading within a century long Fibonacci Channel Up (since the 2029 Great Depression) with clear Bull and Bear Cycles. We will not get into much details on those, as they've been analyzed extensively in previous publications but we will point out that currently we remain inside a multi-year Bull Cycle.
In fact, since the November 2022 market bottom, we believe we've entered the A.I. Bubble, which is in our opinion (perhaps a more aggressive) version of the Internet Bubble of the 1990s. Again this has been analyzed extensively before.
Right now the index is approaching the top of the 0.5 - 0.618 Fib Zone (orange range). The one above (0.618 - 0.786 Fib, red Zone), was first entered in February 1998 and exited for good at the start of the Dotcom crash in February 2001. Since then, the market never even touched it (almost 25 years).
We believe that a marginal test and break inside this 'ghost zone' could be attempting by late 2025 - Q1 2026 and then a strong correction back near the 1M MA50 (blue trend-line) will present the next long-term buy opportunity that could fuel the A.I. Bubble until it finally bursts within 2030 - 2032.
Until then, a 12000 Target on SPX isn't at all an unrealistic one, in our opinion.
-------------------------------------------------------------------------------
** Please LIKE 👍, FOLLOW ✅, SHARE 🙌 and COMMENT ✍ if you enjoy this idea! Also share your ideas and charts in the comments section below! This is best way to keep it relevant, support us, keep the content here free and allow the idea to reach as many people as possible. **
-------------------------------------------------------------------------------
💸💸💸💸💸💸
👇 👇 👇 👇 👇 👇
👑Best Signals (Forex/Crypto+70% accuracy) & Account Management (+20% profit/month on 10k accounts)
💰Free Channel t.me/tradingshotglobal
🤵Contact info@tradingshot.com t.me/tradingshot
🔥New service: next X100 crypto GEMS!
💰Free Channel t.me/tradingshotglobal
🤵Contact info@tradingshot.com t.me/tradingshot
🔥New service: next X100 crypto GEMS!
Declinazione di responsabilità
Le informazioni e le pubblicazioni non sono intese come, e non costituiscono, consulenza o raccomandazioni finanziarie, di investimento, di trading o di altro tipo fornite o approvate da TradingView. Per ulteriori informazioni, consultare i Termini di utilizzo.