STRIDES PHARMA (STAR) – Wave C Completion Zone Hit | Bullish Reversal & Target 1039–1056 Loading?
🧠 Market Structure & Elliott Wave Context
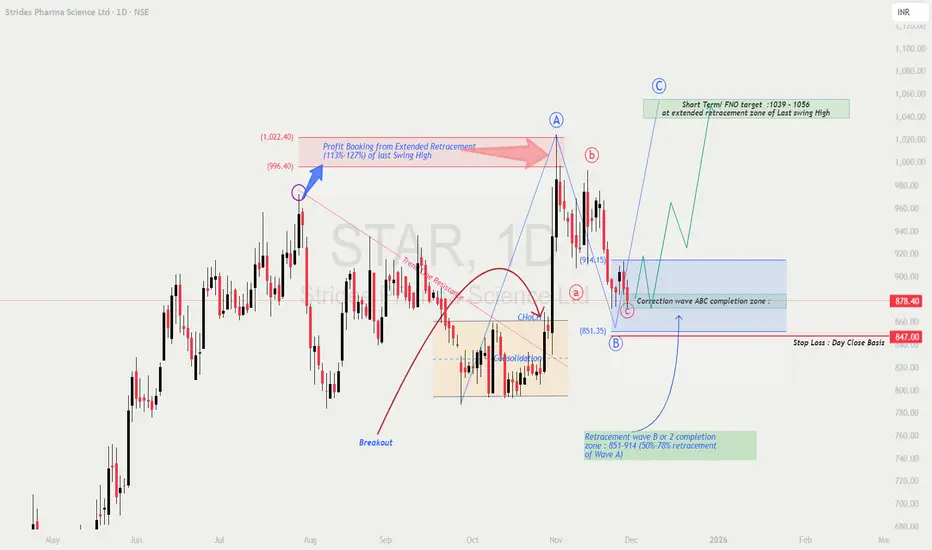
Strides Pharma has completed a classic A–B–C corrective pattern following a strong impulsive Wave A.
Price has now entered the crucial Wave C completion zone → ₹851–₹914, which aligns perfectly with the 50%–78% Fibonacci retracement of Wave A 🔥.
Key structure observations:
Profit booking earlier happened at the 113–127% extended retracement of the last swing high (textbook Elliott Wave Wave A exhaustion).
Price broke out of a consolidation block, then sharply retraced into Wave C.
The current pullback is healthy and controlled, not a trend reversal.
This is exactly where reversal setups typically appear before Wave C → Wave C extension impulses.
📚 Educational Breakdown
🎯 Price Prediction & Upside Targets
If STAR reverses from the ₹851–₹914 Wave C demand zone, bullish upside opens toward:
🎯 Short-Term Target: ₹1039 – ₹1056 (F&O / extended retracement target)
🎯 Medium-Term Target: ₹1085+ (if momentum continues)
Upside activation strengthens if price crosses ₹914–₹920 with volume.
📈 Risk–Reward Perspective
Entry Zone: ₹851 – ₹914
Stop Loss: ₹847 (daily close)
Target: ₹1039–₹1056
Risk: ~₹20–₹40
Reward: ₹125–₹200
👉 Risk–Reward Ratio: Approx 1 : 3.5 to 1 : 6 🚀
(Excellent R:R for swing traders)
💡 Trading Strategy (Educational Only)
🧩 Summary
STAR is showing a high-probability bullish reversal after completing its Wave C at the ideal Fibonacci confluence zone.
If the structure flips bullish, a strong move toward ₹1039 → ₹1056 is likely next.
This setup offers excellent risk–reward and aligns cleanly with Elliott Wave and Fibonacci principles ⚡.
⚠️ Disclaimer
I am not a SEBI-registered analyst.
This analysis is for educational and informational purposes only — not investment advice.
🧠 Market Structure & Elliott Wave Context
Strides Pharma has completed a classic A–B–C corrective pattern following a strong impulsive Wave A.
Price has now entered the crucial Wave C completion zone → ₹851–₹914, which aligns perfectly with the 50%–78% Fibonacci retracement of Wave A 🔥.
Key structure observations:
Profit booking earlier happened at the 113–127% extended retracement of the last swing high (textbook Elliott Wave Wave A exhaustion).
Price broke out of a consolidation block, then sharply retraced into Wave C.
The current pullback is healthy and controlled, not a trend reversal.
This is exactly where reversal setups typically appear before Wave C → Wave C extension impulses.
📚 Educational Breakdown
- 📘 A–B–C Corrective Wave Structure:
Wave A = initial drop
Wave B = retracement (profit taking / liquidity grab)
Wave C = final flush into demand
Once Wave C completes, price usually begins a fresh impulse. - 🔄 50%–78% Fib Retracement (Wave B/2 Zone):
This zone is statistically one of the most reliable reversal regions in corrective legs.
STAR is sitting exactly inside this zone → high-probability bounce area. - 🌀 Extended Retracement Targets (113%–128%):
Wave C → Wave C extension often targets these levels.
Your chart reflects this perfectly for the upside projection. - 📉 Stop-Loss Logic (Risk Control):
A close below ₹847 breaks the structural logic of Wave C completion → invalidation level.
🎯 Price Prediction & Upside Targets
If STAR reverses from the ₹851–₹914 Wave C demand zone, bullish upside opens toward:
🎯 Short-Term Target: ₹1039 – ₹1056 (F&O / extended retracement target)
🎯 Medium-Term Target: ₹1085+ (if momentum continues)
Upside activation strengthens if price crosses ₹914–₹920 with volume.
📈 Risk–Reward Perspective
Entry Zone: ₹851 – ₹914
Stop Loss: ₹847 (daily close)
Target: ₹1039–₹1056
Risk: ~₹20–₹40
Reward: ₹125–₹200
👉 Risk–Reward Ratio: Approx 1 : 3.5 to 1 : 6 🚀
(Excellent R:R for swing traders)
💡 Trading Strategy (Educational Only)
- 🟢 Entry Strategy:
Enter in the ₹851–₹914 zone.
Wait for bullish reversal candles → Hammer, Engulfing, or ChoCH on lower timeframes. - 📈 Confirmation Strategy:
A break above ₹914–₹920 confirms buyer strength → safer entry for wave continuation. - 🎯 Profit Booking Plan:
• Book partial at ₹1039–₹1056
• Trail SL to cost after breakout
• Hold runners for extended move - ⚖️ Risk Management:
• Keep SL strictly below ₹847
• Risk max 1–2% capital
• Don’t average below structure break
🧩 Summary
STAR is showing a high-probability bullish reversal after completing its Wave C at the ideal Fibonacci confluence zone.
If the structure flips bullish, a strong move toward ₹1039 → ₹1056 is likely next.
This setup offers excellent risk–reward and aligns cleanly with Elliott Wave and Fibonacci principles ⚡.
⚠️ Disclaimer
I am not a SEBI-registered analyst.
This analysis is for educational and informational purposes only — not investment advice.
Declinazione di responsabilità
Le informazioni e le pubblicazioni non sono intese come, e non costituiscono, consulenza o raccomandazioni finanziarie, di investimento, di trading o di altro tipo fornite o approvate da TradingView. Per ulteriori informazioni, consultare i Termini di utilizzo.
Declinazione di responsabilità
Le informazioni e le pubblicazioni non sono intese come, e non costituiscono, consulenza o raccomandazioni finanziarie, di investimento, di trading o di altro tipo fornite o approvate da TradingView. Per ulteriori informazioni, consultare i Termini di utilizzo.