TSLA QuantSignals V3 Weekly 2025-11-14
AI & Technical Forecast
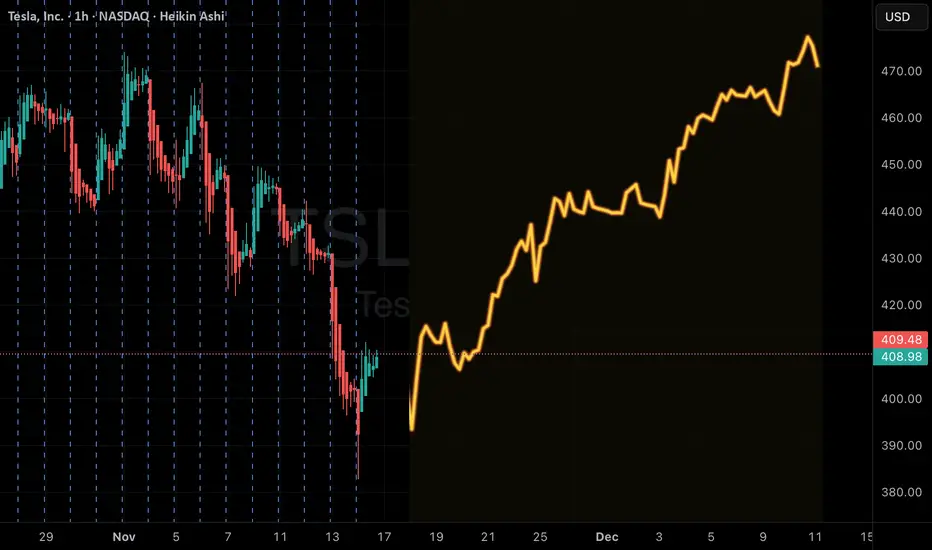
Katy AI Target: $421.69 (+3.2% upside)
Expected Dip: $390.59 Monday before mid-week recovery
Momentum: Strong weekly uptrend, MACD bullish, EMA alignment confirms uptrend
Support: $402.40
Resistance / AI Target: $421.69
Insights:
Friday expiration entry offers volatility discount; deep ITM call captures most delta with minimal extrinsic loss
PCR 3.30 → institutional put-heavy positioning, creating potential contrarian opportunity
Event Risk: Elon Musk fireside chat (Friday 1:05 PM ET) may spike volatility
🎯 Trade Setup
Parameter Value
Direction CALL
Strike $370.00
Entry $40.30–$40.55 (mid: $40.42)
Target 1 $46.00 (+13.8%)
Target 2 $52.00 (+28.6%)
Stop Loss $35.05 (–13.3%)
Position Size 2–3% of portfolio
⚡ Key Advantages
Deep ITM structure → high delta exposure (stock-like behavior)
Limited extrinsic value → reduces theta and IV crush risk
Timing aligned with post-event momentum and mid-week recovery
Risk/Reward ~2.15:1 (Target 1 vs stop)
🚨 Risk Notes
PCR 3.30 → extreme hedging/fear; stop may trigger quickly
Theta decay accelerates Mon-Wed; manage positions carefully
Deep ITM calls → wider spreads; use limit orders
Consider scaling out at Target 1 to reduce gamma exposure
Summary:
TSLA deep ITM weekly call provides contrarian, medium-conviction bullish exposure, leveraging AI trajectory and technical alignment. Suitable for 7-day horizon with disciplined risk management.
AI & Technical Forecast
Katy AI Target: $421.69 (+3.2% upside)
Expected Dip: $390.59 Monday before mid-week recovery
Momentum: Strong weekly uptrend, MACD bullish, EMA alignment confirms uptrend
Support: $402.40
Resistance / AI Target: $421.69
Insights:
Friday expiration entry offers volatility discount; deep ITM call captures most delta with minimal extrinsic loss
PCR 3.30 → institutional put-heavy positioning, creating potential contrarian opportunity
Event Risk: Elon Musk fireside chat (Friday 1:05 PM ET) may spike volatility
🎯 Trade Setup
Parameter Value
Direction CALL
Strike $370.00
Entry $40.30–$40.55 (mid: $40.42)
Target 1 $46.00 (+13.8%)
Target 2 $52.00 (+28.6%)
Stop Loss $35.05 (–13.3%)
Position Size 2–3% of portfolio
⚡ Key Advantages
Deep ITM structure → high delta exposure (stock-like behavior)
Limited extrinsic value → reduces theta and IV crush risk
Timing aligned with post-event momentum and mid-week recovery
Risk/Reward ~2.15:1 (Target 1 vs stop)
🚨 Risk Notes
PCR 3.30 → extreme hedging/fear; stop may trigger quickly
Theta decay accelerates Mon-Wed; manage positions carefully
Deep ITM calls → wider spreads; use limit orders
Consider scaling out at Target 1 to reduce gamma exposure
Summary:
TSLA deep ITM weekly call provides contrarian, medium-conviction bullish exposure, leveraging AI trajectory and technical alignment. Suitable for 7-day horizon with disciplined risk management.
Free Signals Based on Latest AI models💰: QuantSignals.xyz
Declinazione di responsabilità
Le informazioni e le pubblicazioni non sono intese come, e non costituiscono, consulenza o raccomandazioni finanziarie, di investimento, di trading o di altro tipo fornite o approvate da TradingView. Per ulteriori informazioni, consultare i Termini di utilizzo.