During CORRECTIONS it is inciteful to create a CHART, where YOU can watch ALL the INDICES at once.
This is my PERSONAL trading CHART, with no further educational explanations.
IF you get it, YOU GET IT, if you don't, YOU DON'T. I really don't care.
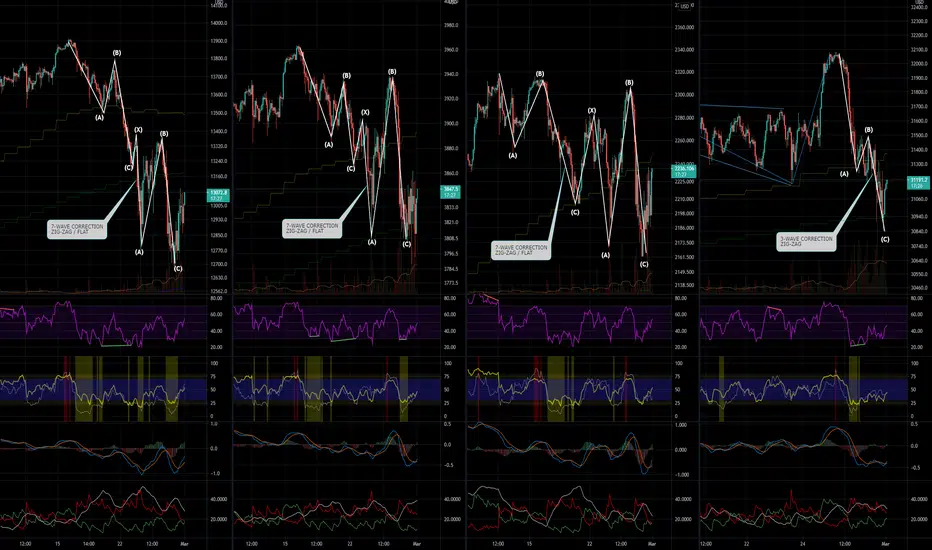
We use ELLIOTT WAVE theory to determine WHAT we are looking for, (i.e. TOP or BOTTOM). THEN technical MULTI-TIME-FRAME Indicator analysis
To fine-tune to what extent price will and when. Enter and exit TRADES in steps ... NEVER go all-in or all-out at ONCE.
This is my PERSONAL trading CHART, with no further educational explanations.
IF you get it, YOU GET IT, if you don't, YOU DON'T. I really don't care.
We use ELLIOTT WAVE theory to determine WHAT we are looking for, (i.e. TOP or BOTTOM). THEN technical MULTI-TIME-FRAME Indicator analysis
To fine-tune to what extent price will and when. Enter and exit TRADES in steps ... NEVER go all-in or all-out at ONCE.
Nota
SLIGHT MODIFICATION on the SPX & RUT ... it just seems better.AS you can see , the INDICES don't CORRECT the same.
Declinazione di responsabilità
Le informazioni e le pubblicazioni non sono intese come, e non costituiscono, consulenza o raccomandazioni finanziarie, di investimento, di trading o di altro tipo fornite o approvate da TradingView. Per ulteriori informazioni, consultare i Termini di utilizzo.
Declinazione di responsabilità
Le informazioni e le pubblicazioni non sono intese come, e non costituiscono, consulenza o raccomandazioni finanziarie, di investimento, di trading o di altro tipo fornite o approvate da TradingView. Per ulteriori informazioni, consultare i Termini di utilizzo.