
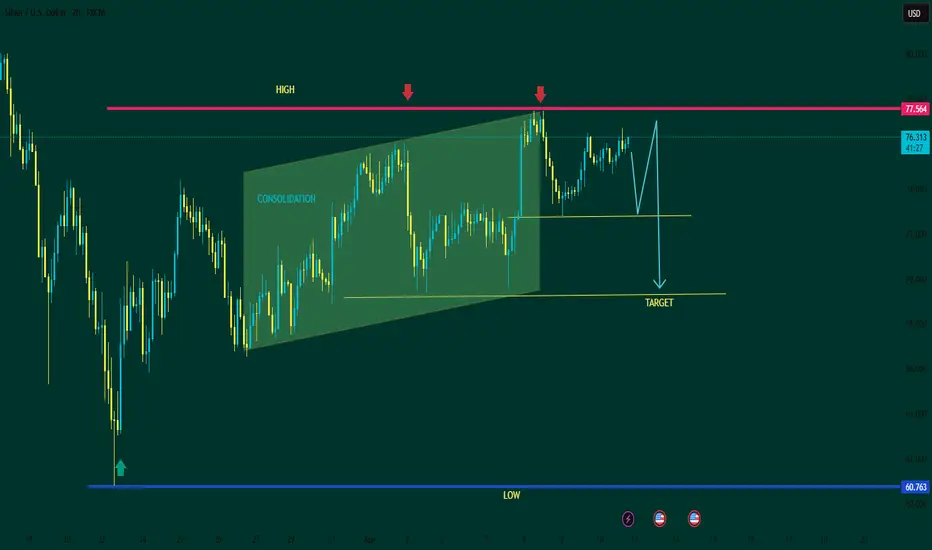
📊 XAG/USD (Silver) 2H Chart – Smart Money Breakdown & Bearish Bias ⚠️
🧠 Market Structure Overview
Price has transitioned from a clear accumulation/consolidation phase into a distribution zone near highs.
The marked range (CONSOLIDATION) shows a gradual upward drift → typical of liquidity building before expansion.
The breakout above the range led to a test of the HIGH (~77.5 area), but failed to sustain momentum.
🔴 Key Resistance Zone (Supply)
The red horizontal line (~77.5) acts as a strong supply zone.
Multiple rejections (indicated by arrows) confirm:
Liquidity sweep above highs
Followed by seller dominance
This suggests smart money likely distributed positions here.
🟡 Current Price Behavior
Price is now:
Struggling below resistance
Forming lower highs on lower timeframes
This signals weak bullish continuation and increasing bearish pressure.
📉 Bearish Scenario (Preferred Bias)
The projected path suggests:
Minor pullback / liquidity grab upward
Strong rejection
Move toward target zone (~70.0)
This aligns with:
Previous support-turned-liquidity pool
Imbalance below current price
🎯 Target Zones
Primary Target: ~70.0 (highlighted)
Extended Target: Could push toward range lows if momentum increases
🟢 Invalidation
A clean break and hold above 77.5 would:
Invalidate bearish bias
Open upside continuation
🧩 Professional Insight
This structure reflects:
Buy-side liquidity taken
Followed by distribution
Classic “trap and reverse” pattern often seen before downside expansion.
⚡ Trading Perspective
Look for:
Rejection candles near resistance
Lower timeframe bearish confirmations (BOS / CHoCH)
Avoid chasing longs in current zone.
🏁 Conclusion
📉 The chart favors a bearish continuation setup after a failed breakout and liquidity sweep.
Smart money behavior suggests distribution at highs → targeting lower liquidity zones.

✦ MARKET STRATEGY SIGNALS ✦ 📊
Smart Money • Price Action • Precision • good entries
📲 Join Telegram: t.me/marketstrategyentry
Smart Money • Price Action • Precision • good entries
📲 Join Telegram: t.me/marketstrategyentry
Pubblicazioni correlate
Declinazione di responsabilità
Le informazioni e le pubblicazioni non sono intese come, e non costituiscono, consulenza o raccomandazioni finanziarie, di investimento, di trading o di altro tipo fornite o approvate da TradingView. Per ulteriori informazioni, consultare i Termini di utilizzo.