Mean Price
^^ Plotting switched to Line.
This method of financial time series (aka bars) downsampling is literally, naturally, and thankfully the best you can do in terms of maximizing info gain. You can finally chill and feed it to your studies & eyes, and probably use nothing else anymore.
(HL2 and occ3 also have use cases, but other aggregation methods? Not really, even if they do, the use cases are ‘very’ specific). Tho in order to understand why, you gotta read the following wall, or just believe me telling you, ‘I put it on my momma’.
The true story about trading volumes and why this is all a big misdirection
Actually, you don’t need to be a quant to get there. All you gotta do is stop blindly following other people’s contextual (at best) solutions, eg OC2 aggregation xD, and start using your own brain to figure things out.
Every individual trade (basically an imprint on 1D price space that emerges when market orders hit the order book) has several features like: price, time, volume, AND direction (Up if a market buy order hits the asks, Down if a market sell order hits the bids). Now, the last two features—volume and direction—can be effectively combined into one (by multiplying volume by 1 or -1), and this is probably how every order matching engine should output data. If we’re not considering size/direction, we’re leaving data behind. Moreover, trades aren’t just one-price dots all the time. One trade can consume liquidity on several levels of the order book, so a single trade can be several ticks big on the price axis.
You may think now that there are no zero-volume ticks. Well, yes and no. It depends on how you design an exchange and whether you allow intra-spread trades/mid-spread trades (now try to Google it). Intra-spread trades could happen if implemented when a matching engine receives both buy and sell orders at the same microsecond period. This way, you can match the orders with each other at a better price for both parties without even hitting the book and consuming liquidity. Also, if orders have different sizes, the remaining part of the bigger order can be sent to the order book. Basically, this type of trade can be treated as an OTC trade, having zero volume because we never actually hit the book—there’s no imprint. Another reason why it makes sense is when we think about volume as an impact or imbalance act, and how the medium (order book in our case) responds to it, providing information. OTC and mid-spread trades are not aggressive sells or buys; they’re neutral ticks, so to say. However huge they are, sometimes many blocks on NYSE, they don’t move the price because there’s no impact on the medium (again, which is the order book)—they’re not providing information.
... Now, we need to aggregate these trades into, let’s say, 1-hour bars (remember that a trade can have either positive or negative volume). We either don’t want to do it, or we don’t have this kind of information. What we can do is take already aggregated OHLC bars and extract all the info from them. Given the market is fractal, bars & trades gotta have the same set of features:
- Highest & lowest ticks (high & low) <- by price;
- First & last ticks (open & close) <- by time;
- Biggest and smallest ticks <- by volume.*
*e.g., in the array ,
2323: biggest trade,
-1212: smallest trade.
Now, in our world, somehow nobody started to care about the biggest and smallest trades and their inclusion in OHLC data, while this is actually natural. It’s the same way as it’s done with high & low and open & close: we choose the minimum and maximum value of a given feature/axis within the aggregation period.
So, we don’t have these 2 values: biggest and smallest ticks. The best we can do is infer them, and given the fact the biggest and smallest ticks can be located with the same probability everywhere, all we can do is predict them in the middle of the bar, both in time and price axes. That’s why you can see two HL2’s in each of the 3 formulas in the code.
So, summed up absolute volumes that you see in almost every trading platform are actually just a derivative metric, something that I call Type 2 time series in my own (proprietary ‘for now’) methods. It doesn’t have much to do with market orders hitting the non-uniform medium (aka order book); it’s more like a statistic. Still wanna use VWAP? Ok, but you gotta understand you’re weighting Type 1 (natural) time series by Type 2 (synthetic) ones.
How to combine all the data in the right way (khmm khhm ‘order’)
Now, since we have 6 values for each bar, let’s see what information we have about them, what we don’t have, and what we can do about it:
- Open and close: we got both when and where (time (order) and price);
- High and low: we got where, but we don’t know when;
- Biggest & smallest trades: we know shit, we infer it the way it was described before.'
By using the location of the close & open prices relative to the high & low prices, we can make educated guesses about whether high or low was made first in a given bar. It’s not perfect, but it’s ultimately all we can do—this is the very last bit of info we can extract from the data we have.
There are 2 methods for inferring volume delta (which I call simply volume) that are presented everywhere, even here on TradingView. Funny thing is, this is actually 2 parts of the 1 method. I wonder how many folks see through it xD. The same method can be used for both inferring volume delta AND making educated guesses whether high or low was made first.
Imagine and/or find the cases on your charts to understand faster:
* Close > open means we have an up bar and probably the volume is positive, and probably high was made later than low.
* Close < open means we have a down bar and probably the volume is negative, and probably low was made later than high.
Now that’s the point when you see that these 2 mentioned methods are actually parts of the 1 method:
If close = open, we still have another clue: distance from open/close pair to high (HC), and distance from open/close pair to low (LC):
* HC < LC, probably high was made later.
* HC > LC, probably low was made later.
And only if close = open and HC = LC, only in this case we have no clue whether high or low was made earlier within a bar. We simply don’t have any more information to even guess. This bar is called a neutral bar.
At this point, we have both time (order) and price info for each of our 6 values. Now, we have to solve another weighted average problem, and that’s it. We’ll weight prices according to the order we’ve guessed. In the neutral bar case, open has a weight of 1, close has a weight of 3, and both high and low have weights of 2 since we can’t infer which one was made first. In all cases, biggest and smallest ticks are modeled with HL2 and weighted like they’re located in the middle of the bar in a time sense.
P.S.: I’ve also included a "robust" method where all the bars are treated like neutral ones. I’ve used it before; obviously, it has lesser info gain -> works a bit worse.
Cerca negli script per "VOLUME DELTA"
Up/Down Volume + DeltaThis simple script is a modification of Tradingview's Up/Down Volume. In this case the delta between the buys and sells is plotted in columns style above the regular up/down volume columns. This gives a better visual of the dominant volume and is useful to spot divergences in tops and bottoms.
The indicators uses data from lower timeframe volumes. By default the lowest timeframe it will use is 1m, but for those that have a premium account you can try using a custom LTF set to seconds when scalping on the 1m chart.
Enjoy :)

Cumulative Volume DeltaCumulative Delta Volume is one of the key analysis in figuring out the Volume Price Action dependencies
Its very Intuitive in nature,
The below image shows how it is computed!
Enjoy

1M XAU Cumulative Delta Volume with OB Breakouts
### Overview
This is a **session-based CVD strategy** built around the **00:00–07:00 CEST range**. It finds the high/low of that session, turns them into **adaptive ATR-based support (yellow)** and **resistance (purple)** zones, and trades only **CVD-confirmed reversals** off those levels.
---
### How it Works
* For each day, the script:
* Builds a 00:00–07:00 CEST **profile high/low**.
* Creates a **support zone** around the session low and a **resistance zone** around the session high.
* Using lower timeframe data, it reconstructs **Cumulative Volume Delta (CVD)** and a **recent delta** filter.
* It arms “pending” states when price **enters a zone from the correct side**, then confirms:
* **BUY (long):** price reclaims above support and recent CVD is strongly positive.
* **SELL (short):** price rejects below resistance and recent CVD is strongly negative.
Only these two CVD signals (`buySignal` / `sellSignal`) open trades.
---
### Strategy Logic
* **Entries**
* `buySignal` → open **long** (if flat).
* `sellSignal` → open **short** (if flat).
* No pyramiding; one position at a time.
* **Exits (only TP & SL)**
* Long: TP at `avg_price * (0.5 + TP%)`, SL at `avg_price * (1 – SL%)`.
* Short: TP at `avg_price * (0.5 – TP%)`, SL at `avg_price * (1 + SL%)`.
* No opposite-signal exits.
---
### Extras
* **Reversal markers** on yellow/purple zones and **breakout/retest markers** are plotted for context and alerts but **do not trigger entries**.
* Zone width and “thickening” are ATR-based so important touches and near-touches are easy to see.
* Only suited for **1m intraday scalping** (e.g. XAU/USD), but can be tested on other markets/timeframes.

CVD Divergences (cdikici71 x tncylyv)CVD Divergence
Summary
This indicator brings the powerful and creative divergence detection logic from @cdikici71's popular "cd_RSI_Divergence_Cx" script to the world of volume analysis.
While RSI is a fantastic momentum tool, I personally choose to rely on volume as a primary source of truth. This script was born from the desire to see how true buying and selling pressure—measured by Cumulative Volume Delta (CVD)—diverges from price action. It takes the brilliant engine built by @cdikici71 and applies it to CVD, offering a unique look into market conviction.
What is Cumulative Volume Delta (CVD)?
CVD is a running total of volume that transacted at the ask price (buying) minus volume that transacted at the bid price (selling). In simple terms, it shows whether buyers or sellers have been more aggressive over a period. A rising CVD suggests net buying pressure, while a falling CVD suggests net selling pressure.
Core Features
• Divergence Engine by @cdikici71: The script uses the exact same two powerful methods for finding divergences as the original RSI version:
o Alignment with HTF Sweep: The default, cleaner method for finding high-probability divergences.
o All: A more sensitive method that finds all possible divergences.
• Anchored CVD Periods: You can choose to reset the CVD calculation on a Daily, Weekly, or Monthly basis to analyze buying and selling pressure within specific periods. Or, you can leave it on Continuous to see the all-time flow.
• Automatic Higher Timeframe (HTF) Alignment: To remove the guesswork, the "Auto-Align HTF" option will automatically select a logical higher timeframe for divergence analysis based on your current chart (e.g., 15m chart uses 4H for divergence, 1H chart uses 1D, etc.). You can also turn this off for full manual control.
• Fully Customizable Information Table: An on-screen table keeps you updated on the divergence status. You can easily adjust its Position and Size in the settings to fit your chart layout.
• Built-in Alerts: Alerts are configured for both Bullish and Bearish divergences to notify you as soon as they occur.
How to Use This Indicator
The principle is the same as any divergence strategy, but with the conviction of volume behind it.
• 🔴 Bearish Divergence: Price makes a Higher High, but the CVD makes a Lower High or an equal high. This suggests that the buying pressure is weakening and may not be strong enough to support the new price high.
• 🟢 Bullish Divergence: Price makes a Lower Low, but the CVD makes a Higher Low or an equal low. This suggests that selling pressure is exhausting and the market may be ready for a reversal.
Always use divergence signals as a confluence with your own analysis, support/resistance levels, and market structure.
Huge Thanks and Credit
This script would not exist without the brilliant and creative work of @cdikici71. The entire divergence detection engine, the visualization style, and the core logic are based on his original masterpiece, "cd_RSI_Divergence_Cx". I have simply adapted his framework to a different data source.
If you find this indicator useful, please go and show your support for his original work!
________________________________________
Disclaimer: This is a tool for analysis, not a financial advice signal service. Please use it responsibly as part of a complete trading strategy.

CVD Absorption + Confirmation [Orderflow & Volume]This indicator detects bullish and bearish absorption setups by combining Cumulative Volume Delta (CVD) with price action, candlestick, and volume confirmations.
🔹 What is Absorption?
Absorption happens when aggressive buyers/sellers push CVD to new highs or lows, but price fails to follow through.
Bearish absorption: CVD makes a higher high, but price does not.
Bullish absorption: CVD makes a lower low, but price does not.
This often signals that limit orders are absorbing aggressive market orders, creating potential reversal points.
🔹 Confirmation Patterns
Absorption signals are only shown if they are validated by one of the following patterns:
Engulfing candle with low volume → reversal faces little resistance.
Engulfing candle with high volume → strong aggressive participation.
Pin bar with high volume → absorption visible in the wick.
CVD flattening / slope reversal → shift in aggressive order flow.
🔹 Signals
✅ Bullish absorption confirmed → Green label below the bar.
❌ Bearish absorption confirmed → Red label above the bar.
Each label represents a potential reversal setup after orderflow absorption is validated.
🔹 Alerts
Built-in alerts are included for both bullish and bearish confirmations, so you can track setups in real-time without watching the chart 24/7.
📌 How to Use:
Best applied at key levels (supply/demand, VWAP, OR, liquidity zones).
Look for confluence with your trading strategy before taking entries.
Works on all markets and timeframes where volume is reliable.

SMT Oscillator: Smarter Money Divergence Detector [PhenLabs]📊Phenlabs - SMT Oscillator: Smarter Money Divergence Detector
Version: PineScript™v6
📌Description
The SMT Oscillator is a sophisticated tool designed to identify smart money divergence between two correlated assets. By analyzing the momentum and volume-weighted price action of a primary and secondary symbol, traders can spot subtle shifts in market dynamics that often precede significant price movements. This indicator is built to provide a clearer, more filtered view of inter-market relationships, solving the common problem of false signals and market noise. Its primary purpose is to equip traders with a quantifiable edge in detecting potential reversals or continuations that are not obvious on a standard price chart.
🚀Points of Innovation
Dual-Symbol Divergence Core: Directly compares momentum (RSI or MACD) between two user-selected symbols to pinpoint true SMT divergence.
Volume-Weighted Analysis: Integrates volume delta into the divergence calculation, giving more weight to moves backed by significant market participation.
Entropy Filter for Noise Reduction: Employs an entropy calculation to filter out low-quality signals during choppy or consolidating market conditions.
Predictive Forecast Line: Utilizes a linear regression model to project the oscillator’s future trajectory, offering a forward-looking glimpse of potential momentum shifts.
Customizable Signal Sensitivity: Allows fine-tuning of overbought and oversold levels to adapt to different market volatilities and trading styles.
Integrated Signal Alerts: Provides built-in alerts for bullish/bearish zero crosses and overbought/oversold conditions.
🔧Core Components
Momentum Engine: The user can select either RSI or MACD as the underlying engine for the divergence calculation, allowing for flexibility in analysis.
Normalization Function: Price data from both symbols is normalized using percentage change to ensure a true “apples-to-apples” comparison, regardless of their nominal price differences.
Divergence Calculator: The core algorithm that subtracts the secondary symbol’s momentum from the primary’s and normalizes the result using the combined standard deviation.
Smoothing Mechanism: An Exponential Moving Average (EMA) is applied to the raw oscillator output to reduce choppiness and provide a clearer signal line.
🔥Key Features
Multi-Asset Comparison: Go beyond single-asset analysis by comparing correlated pairs like ES/NQ or BTC/ETH to uncover hidden trading opportunities.
Heatmap Visualization: An optional heatmap mode provides an intuitive visual representation of divergence strength, making it easier to gauge market sentiment at a glance.
Configurable Lookback and Timeframe: Adjust the lookback period and analysis timeframe to suit your specific strategy, from short-term scalping to long-term trend analysis.
Signal Markers: Visual markers are plotted directly on the chart for bullish and bearish zero-line crossovers, providing clear entry and exit signals.
🎨Visualization
SMT Oscillator Line: The primary visual element, colored blue for bullish (positive) divergence and orange for bearish (negative) divergence.
Zero Line: A solid horizontal line at the zero level, indicating the equilibrium point between the two assets. Crossovers of this line signal a shift in relative strength.
Overbought/Oversold Zones: Dotted lines at the +80 and -80 levels (customizable) that highlight extreme divergence readings, often indicating potential exhaustion points.
Forecast Line: A predictive line that plots the anticipated path of the oscillator, giving traders an advanced warning of potential changes in momentum.
📖Usage Guidelines
Setting Categories
Primary Symbol
Default: (Chart Symbol)
Description: The main asset you are analyzing. Leave blank to use the symbol currently on your chart.
Secondary Symbol
Default: CME_MINI:ES1! (used with NASDAQ futures due to inherent heavy correlation
Description: The asset to compare against the primary symbol.
Lookback Period
Default: 14
Range: 8-100
Description: Controls the calculation window for momentum (RSI/MACD). Higher values result in a smoother, less sensitive oscillator.
Divergence Type
Default: RSI
Options: RSI, MACD
Description: Choose the momentum indicator to use for the divergence calculation.
Enable Volume Weighting
Default: true
Description: When enabled, gives more weight to divergence signals that are accompanied by significant volume.
✅Best Use Cases
Identifying high-probability reversal points by spotting divergence in overbought or oversold territory.
Confirming the strength of a trend by observing sustained positive or negative divergence.
Pairs trading by taking a long position on the outperforming asset and a short position on the underperforming one during a divergence.
Risk management by recognizing when a current trend is losing its underlying momentum.
⚠️Limitations
Requires Correlated Assets: The indicator’s effectiveness is highly dependent on the selection of two assets with a known correlation (e.g., ES and NQ).
Not a Standalone System: Divergence signals should be used in conjunction with other forms of analysis (price action, market structure) and not as a complete trading system.
Lagging by Nature: As it is based on moving averages and past price data, the oscillator is inherently lagging and may not capture all rapid price changes.
💡What Makes This Unique
Combined Momentum & Volume: Unlike standard oscillators, it fuses momentum with volume delta for a more robust “Smart Money” perspective.
Noise-Filtering Mechanism: The proprietary entropy filter is a unique feature designed to weed out insignificant market chatter and focus on high-conviction signals.
🔬How It Works
Data Normalization:
The script first normalizes the price data of the two selected symbols into percentage changes. This ensures that the comparison is fair, regardless of the difference in their price scales.
Momentum Calculation:
It then calculates the chosen momentum value (either RSI or MACD histogram) for each of the normalized price series.
Divergence Computation:
The core of the indicator lies in subtracting the momentum of the secondary symbol from the primary one. This raw divergence is then optionally weighted by volume and filtered for market noise (entropy) to produce the final oscillator value.
💡Note:
For best results, use this indicator on adequate timeframes to filter out market noise. Always confirm signals with price action analysis before entering a trade.

Cumulative Volume Delta with EMA PlotCumulative Delta Volume is a key tool for analyzing the relationship between trading volume and price movement, often referred to as Volume Price Action.
In this indicator, an Exponential Moving Average (EMA) is applied to smooth out short-term noise and reduce volatility, making trends easier to identify. Traders can watch for EMA crossovers as confirmation signals for potential trend reversals, as well as buying or selling opportunities.
CVD Strength | VTS Pro🔷 CVD Strength | VTS Pro
By Alireza Mossaheb
Description:
CVD Strength is a powerful tool designed to analyze market momentum by visualizing the Cumulative Volume Delta (CVD) using advanced techniques. This indicator provides a multi-timeframe view of volume delta behavior and highlights strong and weak bullish/bearish conditions based on volume spikes, candle size, and optional moving average filters.
Key Features:
Multi-timeframe CVD candle plotting with color-coded strength signals
Optional EMA (21), WMA (30), and SMA (50) overlays for trend filtering
Smart strength detection logic using volume, candle size, and moving average crossovers
Bullish and bearish crossover signals marked on chart
Customizable anchor and lower timeframes for flexible analysis
Alerts users when data vendor does not supply volume information
This script is particularly useful for identifying institutional buying/selling pressure and can be used effectively in both trend-following and mean-reversion strategies.

Breakout and Retest Signals [AlgoAlpha]OVERVIEW
This script detects breakout and retest signals by identifying key pivot points in price action and analyzing their relationship with historical swing highs and lows. It highlights breakout structures using ATR-based tolerance levels and volume analysis to confirm potential trend continuations or reversals. The script marks significant price levels with dynamic boxes and dashed lines to help traders visualize breakout and retest areas effectively.
CONCEPTS
The script relies on pivot point analysis, a technique used to identify significant price levels where the market has previously reversed. It dynamically tracks a set number of recent swing highs and lows, allowing traders to see if the price is revisiting a previously significant level. The concept of breakouts and retests is widely used in technical analysis to determine potential entry points. A breakout occurs when the price moves beyond a resistance or support level, and a retest happens when the price returns to test that level before continuing in the breakout direction. This script enhances that analysis by incorporating ATR-based tolerance levels, ensuring that price zones are not too large.
FEATURES
Breakout and Retest Markings : Highlights breakout and retest areas with shaded boxes, allowing traders to visualize where price action is confirming key levels.
Volume Delta and Ratio : Analyzes volume at breakout levels to gauge the strength of the move, displaying volume delta information for additional context. The script also displays the ratio of selling to buying at the retest along traders to make better judgement on their entries.
Multi-Timeframe Adaptability : Dynamically adjusts volume analysis to align with the appropriate lower timeframe, ensuring reliable volume comparisons.
Alerts for Breakout and Retest Events : Traders can receive real-time notifications when bullish or bearish breakout retests are detected.
USAGE
This script is best suited for traders looking to identify strong breakout and retest setups across different timeframes. Users can customize the pivot detection period and swing point memory to adjust sensitivity based on their trading style. The ATR length and multiplier allow further refinement of breakout tolerance, reducing noise in volatile markets. The breakout zones are displayed as shaded boxes, where traders can assess whether a price retest is occurring under favorable conditions. Alerts can be set to notify traders of potential trade opportunities.

Trended CVD [Mxwll]Hey!
This indicator "Trended CVD" categorizes price movement by trend (using zig zag) and calculates cumulative volume delta for the entirety of the price move.
Features
CVD calculated for the trend
CVD divergences are distinguished (uptrend and falling CVD / downtrend and rising CVD)
CVD output normalized to scale with chart, and is plotted alongside the trend
Can be used for trend confirmation (CVD trend correlating with price trend)
All regular zig-zag features available
What constitutes a trend is customizable. Can locate small, medium, large price trends with detailed user-input settings.
How-To Use Trended CVD
The image above shows one of two primary uses for the indicator.
In the left-half of the image, price is downtrending simultaneously with CVD; thereby, CVD is confirming the downtrend.
The right-half of the image shows price uptrending simultaneously with CVD; CVD is confirming the uptrend.
This information can be used to classify the "strength" of the price move, and decide to trade with it or against it.
The image above shows the second primary use for the indicator.
A slight price decrease transpires while CVD increases - CVD diverging upwards from the price trend.
This information can be used to classify the strength of the downtrend, and decide to trade against it, or abstain from trading with it.
The image above shows, subsequent to divergence, price failed to sustain "meaningful" downwards movement.
Labels oriented at the final pivot of a trend show the cumulative volume delta for the entirety of the price move (distinguishable by the superimposed zig zag line).
That's really it! A more complex concept integrated with a simple output.
Thank you!

Delta Volume Weighted - IntradayResets at the start of the day's session (9:50 am on the ASX).
Takes the first candle and checks if its a green candle (close > open), and adds the volume to a total (which starts at 0 at the start of the day).
Subtracts it if the candles in red.
Continues to do this along with all the candles.
The volume is also multiplied by the difference between open and close so that large candles with large volume have more weight and move the indicator more.

Quantum Money Flow PRO [QUANTUM EDITION]Quantum Money Flow PRO is a sophisticated trading indicator that reveals the hidden movements of institutional "smart money" in real-time. Using advanced quantum-inspired algorithms, it analyzes volume, money flow, and market structure to provide professional-grade trading signals with unprecedented accuracy.
⚡ Key Features:
🔍 SMART MONEY DETECTION:
Quantum Delta Analysis: Tracks institutional order flow through volume delta calculations
Money Flow Index (MFI): Identifies overbought/oversold conditions with precision
Power Histogram: Visualizes smart money accumulation/distribution patterns
Open Interest Simulation: Estimates institutional positioning through volume analysis
🎯 TRADING SIGNALS:
QUANTUM STRONG SIGNALS 🌀: High-probability entries with multiple confirmations
QUANTUM WEAK SIGNALS 🟡: Early warnings for potential trend changes
Divergence Detection: Spot hidden reversals before price moves
Convergence Signals: Confirm trend strength with price-indicator alignment
📊 QUANTUM DASHBOARD:
Real-time percentage-based metrics (0-100%)
Color-coded market state identification
Instant signal recognition with emoji indicators
Professional table layout with quantum-themed design
🔄 MULTI-TIMEFRAME ANALYSIS:
Works on all timeframes from 1-minute to monthly
Adaptive calculations for any market condition
Consistent performance across forex, stocks, and crypto
🚨 ALERT SYSTEM:
8 different alert conditions for automated trading
Customizable sound and visual notifications
Mobile push notifications supported
🎨 VISUAL ENHANCEMENTS:
Quantum-themed oscillators with professional styling
Clear overbought/oversold zones with gradient fills
Chart labels for instant signal recognition
Customizable colors to match your trading style
💡 PERFECT FOR:
Day traders seeking institutional edge
Swing traders identifying major turning points
Position traders monitoring smart money flow
Algorithmic traders needing reliable signals
📈 MARKETS:
Forex (All major/minor pairs)
Stocks (NYSE, NASDAQ, etc.)
Cryptocurrencies (BTC, ETH, altcoins)
Indices (SPX, NASDAQ, DOW)
Commodities (Gold, Oil, etc.)
🔧 EASY SETUP:
Apply to any chart
Customize colors and alerts in settings
Watch quantum signals appear in real-time
Trade with institutional-level insight
⚠️ RISK DISCLAIMER:
This indicator is for educational and informational purposes only. Always practice proper risk management and backtest strategies before live trading. Past performance does not guarantee future results.

KKTT V9Description for Publication
Order Flow + Opening Range Trend Dashboard Combo
This indicator combines Cumulative Volume Delta (CVD) momentum, Opening Range breakout levels, and a Multi-Timeframe Trend Dashboard to provide a complete intraday market view.
Features:
CVD Momentum (Order Flow):
Detects real buying/selling pressure by tracking cumulative delta between bullish and bearish candles.
Buy signal → when CVD crosses above its EMA, price above EMA200, and volume above average.
Sell signal → when CVD crosses below its EMA, price below EMA200, and volume above average.
Opening Range Levels:
Automatically marks the key session opening price, upper breakout (Buy Line), and lower breakout (Sell Line).
Helps identify potential breakout zones for major sessions (e.g., Asia, Europe, US).
Trend Dashboard:
Displays the trend status for multiple timeframes (D1, H4, H1, H15).
Green → Uptrend
Red → Downtrend
Orange → Sideways
Use this dashboard to align intraday signals with higher-timeframe trends.
Usage Tips:
Prioritize buy signals when higher-timeframe trends are bullish.
Prioritize sell signals when higher-timeframe trends are bearish.
Combine with support/resistance zones for better confirmation.
This script provides a clear visualization of order flow strength, market structure, and session volatility — ideal for traders who want to capture directional moves with strong momentum confirmation.

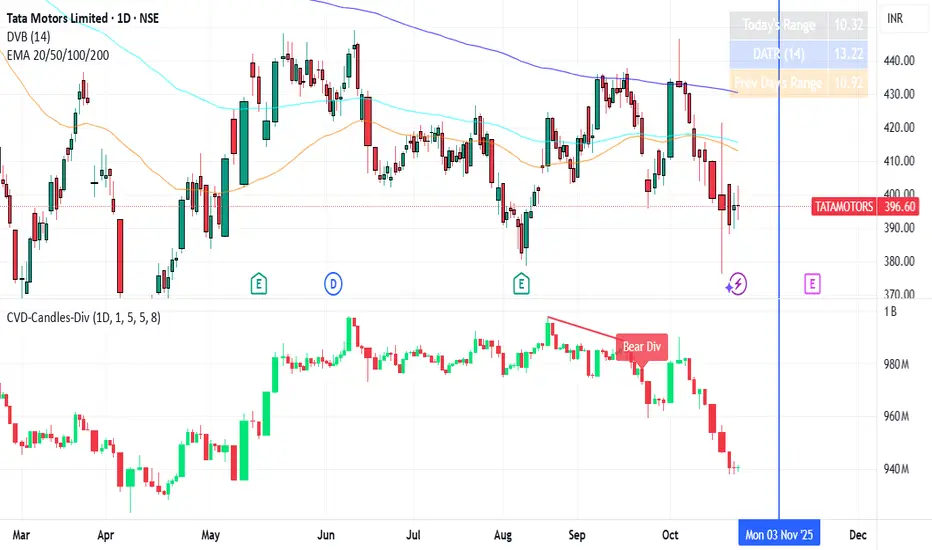
CVD Candles + Divergence (Pane) [NIRALA]This indicator provides a powerful way to analyze market dynamics by visualizing Cumulative Volume Delta (CVD) as candlesticks and automatically detecting divergences between price and order flow. It is designed to help traders spot potential trend exhaustion and reversals that may not be apparent from price action alone.
Key Concepts
Cumulative Volume Delta (CVD): CVD is a running total of the difference between buying and selling volume from market orders. A rising CVD indicates aggressive buying, while a falling CVD indicates aggressive selling. Unlike price, which can be influenced by passive limit orders, CVD shows the raw intent of aggressive market participants.
Divergence: A divergence occurs when price and CVD move in opposite directions. This signals a potential conflict between price action and the underlying order flow, often preceding a reversal.
Bearish Divergence: Price makes a new high, but CVD fails to make a new high (or makes a lower high). This suggests buying aggression is weakening despite the higher price, and a reversal to the downside may be imminent.
Bullish Divergence: Price makes a new low, but CVD fails to make a new low (or makes a higher low). This suggests selling pressure is drying up, and a reversal to the upside may be coming.
Features
CVD as Candlesticks: Plots CVD in a familiar OHLC candlestick format in a separate pane, providing a more intuitive view of order flow momentum and volatility compared to a simple line.
Automatic Divergence Detection: The script automatically identifies classic bullish and bearish divergences between price pivots and CVD pivots, drawing lines on both the main price chart and the indicator pane to clearly highlight them.
Multi-Timeframe Analysis: Calculates CVD from a user-defined lower timeframe, offering a more granular and precise view of the order flow that builds up a single candle on your chart.
Customizable Pivot Lookbacks: Allows you to adjust the sensitivity of the pivot detection for finding both short-term and long-term divergences.
Alerts: Includes built-in alerts that can notify you when a new bullish or bearish divergence is confirmed.
How to Use
Look for High-Probability Setups: This indicator is most powerful when its signals appear at key areas of support or resistance. A divergence at a major price level is a much stronger signal than one in the middle of a range.
Confirm with Price Action: Do not trade on a divergence signal alone. Wait for a confirmation candle (e.g., a bearish engulfing candle after a bearish divergence, or a bullish hammer after a bullish divergence) before considering an entry.
Combine with Your Strategy: Use this indicator as a confirmation tool to enhance your existing trading strategy. For example, if your primary strategy gives a sell signal and this indicator simultaneously prints a bearish divergence, it significantly increases the probability of the trade.
This tool is designed for discretionary traders looking to add a layer of order flow analysis to their decision-making process.
Volume Aggression Monitor📌 Volume Aggression Monitor — Overview
This indicator helps identify buying and selling pressure (aggression) in real-time by analyzing how market participants are executing trades. It is composed of three main components:
🔍 What Does It Show?
🧭 1. The Thermometer (Above Candles)
🟢 Green Arrow (▲) → Buy Aggression: Buyers are lifting the ask.
🔴 Red Arrow (▼) → Sell Aggression: Sellers are hitting the bid.
⚪ Gray Square (■) → Neutral: No significant price movement or aggression.
💡 Neutral in this context means:
The price barely moved during the candle (open-close % change < direction_threshold, default 0.05%).
No clear buyer or seller dominance. It often appears during low volatility, equilibrium, or market indecision periods. This prevents noise and false directional readings due to random micro-movements.
📊 2. Percentage Panel
A table displaying recent trades or candle data (from a lower timeframe). Colored arrows indicate the direction of aggression (buy/sell). Shows volume, delta, and aggression %.
✅ Use it to:
Track clusters of buy/sell aggression. Spot momentum builds.
⏱️ 3. Cumulative Times & Sales Bar
A horizontal progress bar representing cumulative aggression.
Positive = Buy Aggression dominates.
Negative = Sell Aggression dominates.
📉 Even in sideways price movement, this bar shows who is winning the fight under the surface.
---
🧠 How to Use It:
🔹 Confirm Trades
Use the thermometer and aggression signals to confirm your strategy entries (e.g., breakouts, pullbacks, support/resistance).
🔹 Detect Dominance
Observe who is in control: buyers or sellers? Are they pressing or hesitating?
🔹 Filter Market Noise
The neutral state avoids misinterpreting small, meaningless movements as strong signals.
---
Component | Meaning
🌡️ Thermometer (▲ ▼ ■) | Who’s in control in each candle
📊 Percentage Panel | Trade details: direction, delta, aggression
📈 Cumulative T&S Bar | Overall aggression bias over time
---

Order Flow Hawkes Process [ScorsoneEnterprises]This indicator is an implementation of the Hawkes Process. This tool is designed to show the excitability of the different sides of volume, it is an estimation of bid and ask size per bar. The code for the volume delta is from www.tradingview.com
Here’s a link to a more sophisticated research article about Hawkes Process than this post arxiv.org
This tool is designed to show how excitable the different sides are. Excitability refers to how likely that side is to get more activity. Alan Hawkes made Hawkes Process for seismology. A big earthquake happens, lots of little ones follow until it returns to normal. Same for financial markets, big orders come in, causing a lot of little orders to come. Alpha, Beta, and Lambda parameters are estimated by minimizing a negative log likelihood function.
How it works
There are a few components to this script, so we’ll go into the equation and then the other functions used in this script.
hawkes_process(params, events, lkb) =>
alpha = clamp(array.get(params, 0), 0.01, 1.0)
beta = clamp(array.get(params, 1), 0.1, 10.0)
lambda_0 = clamp(array.get(params, 2), 0.01, 0.3)
intensity = array.new_float(lkb, 0.0)
events_array = array.new_float(lkb, 0.0)
for i = 0 to lkb - 1
array.set(events_array, i, array.get(events, i))
for i = 0 to lkb - 1
sum_decay = 0.0
current_event = array.get(events_array, i)
for j = 0 to i - 1
time_diff = i - j
past_event = array.get(events_array, j)
decay = math.exp(-beta * time_diff)
past_event_val = na(past_event) ? 0 : past_event
sum_decay := sum_decay + (past_event_val * decay)
array.set(intensity, i, lambda_0 + alpha * sum_decay)
intensity
The parameters alpha, beta, and lambda all represent a different real thing.
Alpha (α):
Definition: Alpha represents the excitation factor or the magnitude of the influence that past events have on the future intensity of the process. In simpler terms, it measures how much each event "excites" or triggers additional events. It is constrained between 0.01 and 1.0 (e.g., clamp(array.get(params, 0), 0.01, 1.0)). A higher alpha means past events have a stronger influence on increasing the intensity (likelihood) of future events. Initial value is set to 0.1 in init_params. In the hawkes_process function, alpha scales the contribution of past events to the current intensity via the term alpha * sum_decay.
Beta (β):
Definition: Beta controls the rate of exponential decay of the influence of past events over time. It determines how quickly the effect of a past event fades away. It is constrained between 0.1 and 10.0 (e.g., clamp(array.get(params, 1), 0.1, 10.0)). A higher beta means the influence of past events decays faster, while a lower beta means the influence lingers longer. Initial value is set to 0.1 in init_params. In the hawkes_process function, beta appears in the decay term math.exp(-beta * time_diff), which reduces the impact of past events as the time difference (time_diff) increases.
Lambda_0 (λ₀):
Definition: Lambda_0 is the baseline intensity of the process, representing the rate at which events occur in the absence of any excitation from past events. It’s the "background" rate of the process. It is constrained between 0.01 and 0.3 .A higher lambda_0 means a higher natural frequency of events, even without the influence of past events. Initial value is set to 0.1 in init_params. In the hawkes_process function, lambda_0 sets the minimum intensity level, to which the excitation term (alpha * sum_decay) is added: lambda_0 + alpha * sum_decay
Alpha (α): Strength of event excitation (how much past events boost future events).
Beta (β): Rate of decay of past event influence (how fast the effect fades).
Lambda_0 (λ₀): Baseline event rate (background intensity without excitation).
Other parts of the script.
Clamp
The clamping function is a simple way to make sure parameters don’t grow or shrink too much.
ObjectiveFunction
This function defines the objective function (negative log-likelihood) to minimize during parameter optimization.It returns a float representing the negative log-likelihood (to be minimized).
How It Works:
Calls hawkes_process to compute the intensity array based on current parameters.Iterates over the lookback period:lambda_t: Intensity at time i.event: Event magnitude at time i.Handles na values by replacing them with 0.Computes log-likelihood: event_clean * math.log(math.max(lambda_t_clean, 0.001)) - lambda_t_clean.Ensures lambda_t_clean is at least 0.001 to avoid log(0).Accumulates into log_likelihood.Returns -log_likelihood (negative because the goal is to minimize, not maximize).
It is used in the optimization process to evaluate how well the parameters fit the observed event data.
Finite Difference Gradient:
This function calculates the gradient of the objective function we spoke about. The gradient is like a directional derivative. Which is like the direction of the rate of change. Which is like the direction of the slope of a hill, we can go up or down a hill. It nudges around the parameter, and calculates the derivative of the parameter. The array of these nudged around parameters is what is returned after they are optimized.
Minimize:
This is the function that actually has the loop and calls the Finite Difference Gradient each time. Here is where the minimizing happens, how we go down the hill. If we are below a tolerance, we are at the bottom of the hill.
Applied
After an initial guess the parameters are optimized with a mix of bid and ask levels to prevent some over-fitting for each side while keeping some efficiency. We initialize two different arrays to store the bid and ask sizes. After we optimize the parameters we clamp them for the calculations. We then get the array of intensities from the Hawkes Process of bid and ask and plot them both. When the bids are greater than the ask it represents a bullish scenario where there are likely to be more buy than sell orders, pushing up price.
Tool examples:
The idea is that when the bid side is more excitable it is more likely to see a bullish reaction, when the ask is we see a bearish reaction.
We see that there are a lot of crossovers, and I picked two specific spots. The idea of this isn’t to spot crossovers but avoid chop. The values are either close together or far apart. When they are far, it is a classification for us to look for our own opportunities in, when they are close, it signals the market can’t pick a direction just yet.
The value works just as well on a higher timeframe as on a lower one. Hawkes Process is an estimate, so there is a leading value aspect of it.
The value works on equities as well, here is NASDAQ:TSLA on a lower time frame with a lookback of 5.
Inputs
Users can enter the lookback value and timeframe.
No tool is perfect, the Hawkes Process value is also not perfect and should not be followed blindly. It is good to use any tool along with discretion and price action.

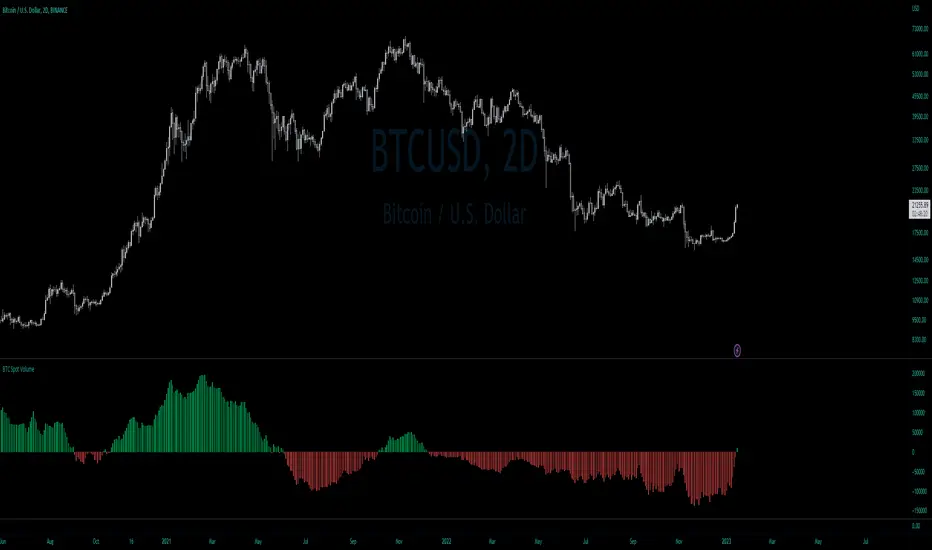
BTC Net Volume (Spot) (by JaggedSoft, fixed by SLN)• WHAT:
This indicator plots the aggregated net volume delta of BTC spot pairs from 8 exchanges over the last 60 periods (default settings).
Tracks the following pairs:
"BINANCE:BTCUSDT"
"BITFINEX:BTCUSD"
"POLONIEX:BTCUSDT"
"BITTREX:BTCUSDT"
"COINBASE:BTCUSD"
"BITSTAMP:BTCUSD"
"KRAKEN:XBTUSD"
"BITGET:BTCUSDT"
"GEMINI:BTCUSD"
• HOW TO USE:
Used for confirmation when watching futures that can experience quick movements in the form of liquidation-events. If the oscillator is green or trending upward, it's confirming a positive bias. The inverse is true for a negative bias. This is especially true on higher timeframes.
Can also be used to find correlations between different tech-assets.
• NOTES:
I forked JaggedSofts indicator to fix the data-source error it was having. Let me know if you want to customize exchanges or add more pairs, maybe I can add that in the future!
This indicator replaces the outdated alternative linked here : Please only use this one
• LIMITATIONS:
Only tested with normal japanese candlesticks .
• THANKS:
to the creator of this script, JaggedSoft. It's a great indicator!
• DISCLAIMER:
Not financial Advice, use at your own risk.
Volume Pressure and PercentVPP Volume Pressure and Percentage Indicator with a Volume Trendline that indicates which side is driving the flow.
Features:
1. Buy/Sell Pressure Bars (Core Volume Split)
The indicator separates each candle’s volume into buy volume (green) above the zero line and sell volume (red) below it. This gives you a real-time visualization of which side is more aggressive within the current bar. Instead of waiting for prices to move or candles to close, you can instantly see whether buyers or sellers are stepping in.
2. Dynamic Total Volume (Invisible Histogram + Status Line Color)
The total volume of each bar is tracked behind the scenes and displayed in the pinned status line using a dynamic color—green when buyers dominate, red when sellers dominate. The histogram for total volume is invisible to keep the chart clean, but the total volume figure stays visible and changes color based on who is in control. This gives you instant confirmation of whether institutional-sized volume supports the direction shown by the buy/sell pressure, which is especially valuable when evaluating the risk or conviction behind a potential entry.
3. Percentage Mode (% of Bar Volume)
When toggled on, the indicator converts each bar into percent buy vs percent sell, normalizing all flow to a 0–100% scale. This mode is incredibly useful when comparing pressure across different times of day, gaps, or varying volume conditions—such as early morning spikes versus lunchtime chop. By removing absolute volume from the equation, you gain a clean look at the actual imbalance between buyers and sellers.
4. 70% Pressure Band (Imbalance Threshold Zone)
In percentage mode, the indicator displays a subtle 70% band (a light gray zone) above and below the zero line, showing where buy or sell pressure reaches extreme dominance (≥70%). When a bar’s buy or sell percentage enters this zone, it highlights moments of exhaustion, acceleration, or potential reversal. The band acts like a real-time overbought/oversold gauge specifically for volume imbalance, not price.
5. Trend Line (Net Pressure Trend / Reversal Detector)
The trend line smooths out the net volume pressure (buy volume minus sell volume or its percentage equivalent) and shows the overall direction of order flow. When the line slopes upward, buyers are gaining control; when it slopes downward, sellers are taking over. This trend line acts as a real-time momentum indicator based directly on flow rather than price. Because it reacts quickly to intrabar shifts in buy/sell pressure, it often turns before price does—giving you a measurable timing edge.
6. Auto-Selecting Trend Source (Volume Net, Percent Net, or CVD)
The indicator lets you choose how the trend line is calculated: Volume Net (buy minus sell volume), Percent Net (normalized imbalance), or CVD (Cumulative Volume Delta) for long-term flow bias. The default “Auto” mode automatically switches between Volume Net and Percent Net depending on which view you’re using. This flexibility allows the trend line to remain meaningful whether you’re analyzing raw volume or normalized percentage data.
7. Pinned (Status Line) Totals in K/M/B Format
Regardless of whether you’re in volume or percentage mode, the indicator always displays Total Volume, Buy Volume, and Sell Volume in the status line using abbreviated K, M, B formatting. These values update in real time and are color-coded: green for bullish dominance, red for bearish. This gives you a concise snapshot of order flow strength on every bar.
---------------------
How To Use:
Support Level Zones
• Watch for Buy bars increasing + Trend line flipping up right at or slightly below support.
• This often signals absorption — market makers filling large buy orders before reversal.
• Confirmation: Price reclaims VWAP ... enter calls / longs.
Resistance Level Zones
• Watch for Sell bars increasing + Trend line flattening/turning down near resistance.
• This signals distribution or stop runs.
• Confirmation: Price rejects VWAP ... enter puts / shorts.
Breakout Traps
• Sometimes you’ll see price break a level, but the flow doesn’t confirm (buy volume doesn’t expand).
• That’s a false breakout — fade it with options opposite the move.

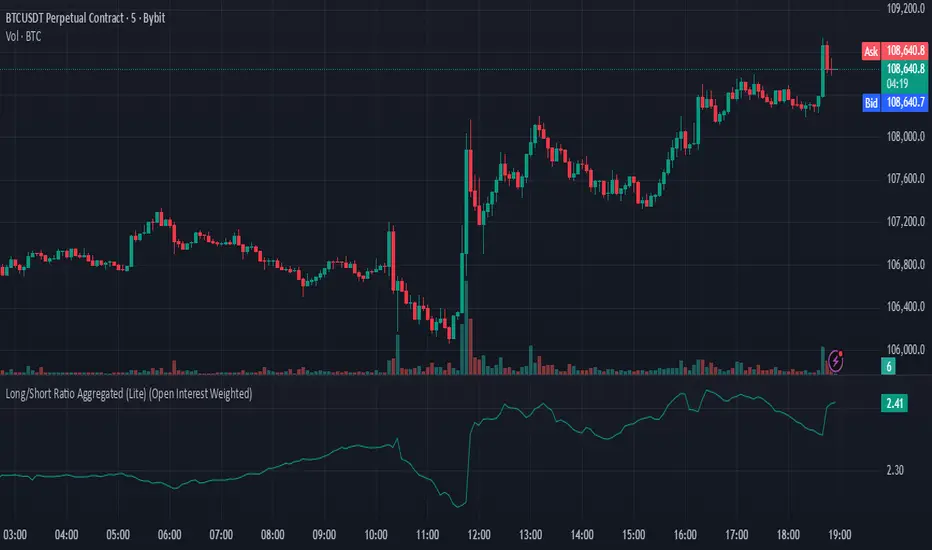
Long/Short Ratio Aggregated (Lite)Description — Long/Short Ratio Aggregated (Lite)
This indicator provides a cross-exchange, open-interest-weighted aggregation of the Long/Short Ratio (LSR) for the cryptocurrency asset currently on your chart. It is designed to unify fragmented derivatives positioning data from multiple major exchanges into a single normalized signal that more accurately reflects real market sentiment and positioning bias across platforms.
Concept and Originality
Traditional Long/Short Ratio indicators are exchange-specific. They show how many traders are long versus short, but only within the scope of one venue (e.g., Binance or Bybit). This makes them incomplete and often misleading for directional bias analysis, since different exchanges host different participant profiles, levels of leverage, and quote-currency exposures.
This script addresses that limitation by:
Aggregating LSR data across multiple exchanges (Binance and Bybit).
Weighting each ratio by Open Interest (OI) — ensuring exchanges with higher open positions contribute proportionally more to the overall sentiment.
Normalizing all contract types (USDT, USDC, and USD-margined) into a consistent base-currency format.
This step corrects for structural differences between coin- and stablecoin-margined instruments, producing a true like-for-like comparison.
The result is a globalized Long/Short Ratio, normalized by exposure and liquidity, suitable for multi-venue orderflow estimation and directional bias assessment.
Note for moderators: I know there are already other scripts out there, but they may not support Open Interest Weighting or the same number of pairs. They also might not support proper normalization like in my script.
Calculation Methodology
For each supported exchange and contract type:
The script retrieves the latest Long/Short Ratio (LSR) and Open Interest (OI) values.
OI is used as the weighting factor, creating a proportional representation of positioning volume.
Values denominated in USD are normalized into base currency using close-price adjustment.
The final value is computed as:
Weighted LSR = (Σ (LSRᵢ × OIᵢ)) / (Σ OIᵢ)
This ensures that if, for example, Binance has twice the open interest of Bybit, its LSR contributes twice as much to the total weighted sentiment.
Interpretation
Value > 1.0 → Market participants are net-long (bullish bias).
Value < 1.0 → Market participants are net-short (bearish bias).
Strength of deviation from 1.0 indicates positioning imbalance magnitude.
Because the ratio is OI-weighted, large players or heavily margined exchanges influence the output proportionally more than smaller, low-volume venues — making this metric a better reflection of true market positioning rather than isolated retail sentiment.
Usage and Applications
Use this indicator as a component in:
Orderflow and sentiment confirmation, alongside price action and volume.
Funding rate correlation studies.
Intraday reversals or exhaustion zones, when combined with volatility or OI delta metrics.
Overlaying or combining this indicator with open interest change, cumulative volume delta, or funding rate divergence allows traders to build a high-resolution understanding of positioning shifts and crowd behavior.
Notes
The “Lite” version is optimized for execution and accessibility, focusing on accuracy while staying within Pine Script’s computational limits.
Exchange data availability may vary by symbol; unsupported pairs automatically return na and are automatically not included in the weighted calculation.
In summary:
This indicator transforms fragmented, exchange-specific Long/Short Ratio into a unified, OI-weighted global sentiment measure — a foundational tool for traders seeking to quantify derivative-side orderflow bias with cross-venue accuracy.
Layered Volume Delta (LVD) BarsThis volume indicator shows buying and selling delta pressure in each bar.

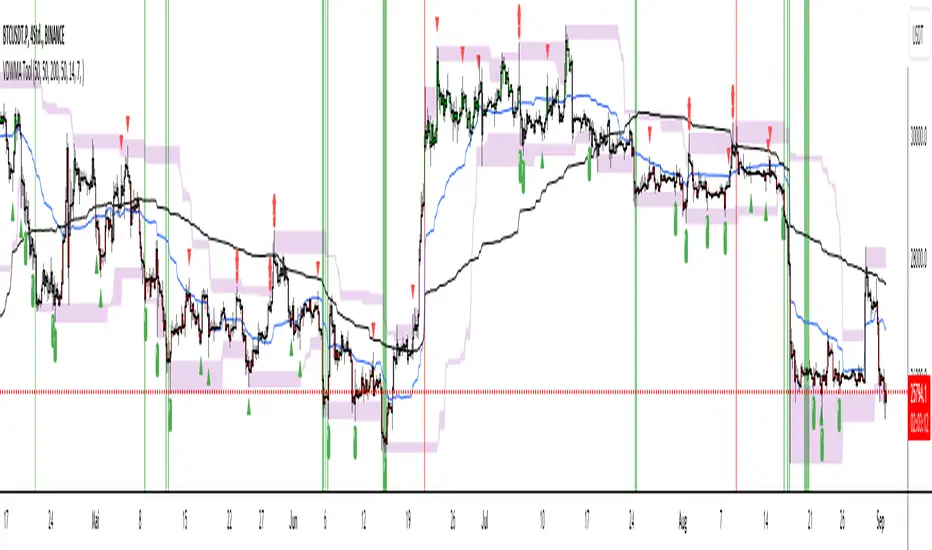
Trade Tool VDWMA + OI RSI BasedThis indicator works only for symbols where open interest data is available.
The idea was to create a combination of Volume Delta, Open Interest, RSI, Moving Average and Support / Resistance as a unified tool.
I created a Weighted Moving Average based on the Volume Delta (VDWMA). The idea behind this was to reflect the moving average on the difference between buy and sell volume.
There are two VDWMA to determine a trend. Fast and Slow. The principle is the same as with conventional moving averages. For visualization, the candles are colored based on the following logic:
up trend = Fast VDWMA is above the Slow VDWMA and the price is above the Fast VWDWMA.
down Trend = Fast VDWMA is below the Slow VDWMA and the Short is below the Fast VDWMA
Further, support and resistance zones were defined based on the close and high prices as well as close and low prices.
A simple logic looks for divergences between RSI and price to generate first signals for possible price reversals.
Another RSI was created based on the open interest.
In combination with the conventional RSI, oversold and overbought zones were defined based on the following logic, which are marked by vertical zones on the chart.
Oversold zone = RSI is below 30 and OI RSI is above 70 or below 30 and OI opening is not greater than OI closing price
Overbought zone = RSI is above 70 and OI RSI is above 70 or below 30 and OI opening is not smaller than OI closing price
Based on this, buy and sell signals were defined.
First, the support or resistance zone must remain the same for two candles, which signals that the zone has not been breached. In addition, a divergence must occur in the RSI and the price must bounce.
newsell = resistance == resistance and high >= resistance and close < resistance and bearishDiv
newbull = support == support and low <= support and close > support and bullishDiv
The OI signaling was deliberately not included as well as the trend function. The tool should be suitable for scalping as well as for swinging. Thus, depending on the tradestyle itself to decide which points you want to trade.
Have fun with it
DELTA VOLThe indicator shows the volume of buy and sell separately as well as the volume delta, it can be used together with the Open Interest to see if the price rises due to the opening of Long or the closing of Short and in the same way to see if the price falls due to the opening of Short or Longs closing
