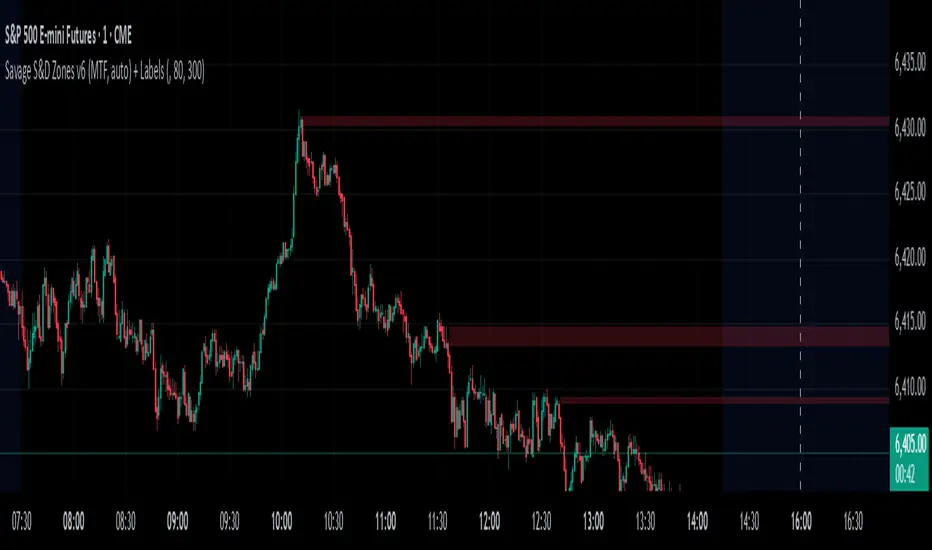
Savages Supply and Demand LevelsThis supply and demand indicator in my opinion is one of the best S&D indicators on trading view. It is clean, organized and just simple. I have spent thousands of hours determining the best and most reliable ways to identify supply and demand, on every time frame! I am going to explain exactly what I look for.
When looking for a supply level meaning, there is potential for more supply of the following stock to hit the marker, what does that mean? People are going to sell. SO, it represents possible sell ordered at that supply level. So lets get into the grit of this, there are two candles that form when a supply level is formed. The first candle needs to be green, it will have a high, a low , an open and a close. The specifics come into play with the next candle which needs to be red, that candle can NOT break the previous green candles high, and needs to close below the previous candles low. THATS IT! That is a supply level. Now, for a demand level, its the same thing just switched, we need a red candle, that will have a high,low, open and a close. Same thing now, the next candle is going to be green, that green candle can NOT break that previous red candles low and needs to close above that previous red candles high. THATS A DEMAND!
I have spent countless hours back testing and studying this, I am extremely confident that this will be a game changer for whoever uses this. I have marked different types of opening and closes and highs and lows and this specific type of setup has worked countless times for me, the only time it will not work is when there is a liquidity sweep or some sort of news where it causes the price action to swing several points. Also do not use only one time frame and only this indicator, try to use some fair value gap levels and break of structure indicators, there are really good ones on here. I have also built the indicator to get rid of supply and demand levels that have already been hit so you always have a clean and fresh supply and demand level that has not been eaten into yet. I also threw some clean labels on there so it is easy to identify. So once price action hits that supply or demand level, it goes away, it either worked or it gets invalidated.
I hope you enjoy!
Not financial advice
-Savage
Cerca negli script per "sweep"
DTLLC Time & PriceDTLLC Time and Price with Signals
This indicator is built for traders who understand ICT concepts and want a structured, visual way to align time-based price action with key market levels. By combining customizable trading windows, breakout logic, and daily reference points, it helps you identify high-probability trade opportunities while filtering out market noise.
Key Features
1. Dual Custom Time Ranges (Kill Zones)
Set two independent time ranges per day (start/end hour and minute).
Each range identifies the highest high and lowest low within its window.
Built-in breakout detection generates buy/sell signals when price moves beyond these levels.
2. Volatility Filtering
Adjustable volatility threshold based on True Range relative to ATR.
Filters out low-quality signals during choppy, low-volatility conditions.
3. ATR-Based Stop Loss
Custom ATR length and stop-loss multiplier settings.
Automatically plots ATR-based stop levels for triggered trades.
4. Daily Key Levels
Plots Previous Day High, Previous Day Low, and Midnight Open continuously on the chart.
Useful for spotting breakout and reversal opportunities in line with ICT market structure concepts.
5. Liquidity & Engulfing Candle Highlights
Highlights potential liquidity grab zones (yellow candles) when significant highs/lows are set within your lookback period.
Detects bullish (green) and bearish (red) engulfing patterns for added confluence.
6. Visual & Signal Tools
Buy/Sell signals plotted directly on chart (separate colors for Range 1 and Range 2). Continuous plotting of reference levels to maintain market context throughout the session.
Example Use Case:
A common ICT-inspired reversal setup:
Wait for price to sweep the Previous Day’s High or Low during your chosen time range.
Look for a buy or sell signal with volatility confirmation.
Manage risk using the ATR-based stop-loss plot.
Disclaimer: This script is for educational purposes only and is not financial advice. Trade responsibly and always test strategies before applying them in live markets.

Advanced Liquidity & FVG Detector With Entry/Exit SignalsThe Advanced Liquidity & FVG Detector is more than just an indicator—it's a complete trading system that brings institutional-grade market analysis to individual traders. By combining liquidity detection, fair value gap analysis, sweep/grab pattern recognition, and intelligent risk management, this indicator provides everything needed for sophisticated market analysis and high-probability trading opportunities.
Whether you're a day trader, swing trader, or position trader, this indicator adapts to your style and timeframe, providing the insights needed to make informed trading decisions with confidence. The Pine Script v6 compatibility ensures future-proof performance and seamless integration with the latest TradingView features.
Transform your trading experience with professional-grade market structure analysis—tradable insights delivered in real-time, right on your chart.

Enhanced Market Structure StrategyATR-Based Risk Management:
Stop Loss: 2 ATR from entry (configurable)
Take Profit: 3 ATR from entry (configurable)
Dynamic Position Sizing: Based on ATR stop distance and max risk percentage
Advanced Signal Filters:
RSI Filter:
Long trades: RSI < 70 and > 40 (avoiding overbought)
Short trades: RSI > 30 and < 60 (avoiding oversold)
Volume Filter:
Requires volume > 1.2x the 20-period moving average
Ensures institutional participation
MACD Filter (Optional):
Long: MACD line above signal line and rising
Short: MACD line below signal line and falling
EMA Trend Filter:
50-period EMA for trend confirmation
Long trades require price above rising EMA
Short trades require price below falling EMA
Higher Timeframe Filter:
Uses 4H/Daily EMA for multi-timeframe confluence
Enhanced Entry Logic:
Regular Entries: IDM + BOS + ALL filters must pass
Sweep Entries: Failed breakouts with tighter stops (1.6 ATR)
High-Probability Focus: Only trades when multiple confirmations align
Visual Improvements:
Detailed Entry Labels: Show entry, stop, target, and risk percentage
SL/TP Lines: Visual representation of risk/reward
Filter Status: Bar coloring shows when all filters align
Comprehensive Statistics: Real-time performance metrics
Key Strategy Parameters:
pinescript// Recommended Settings for Different Markets:
// Forex (4H-Daily):
// - CHoCH Period: 50-75
// - ATR SL: 2.0, ATR TP: 3.0
// - All filters enabled
// Crypto (1H-4H):
// - CHoCH Period: 30-50
// - ATR SL: 2.5, ATR TP: 4.0
// - Volume filter especially important
// Indices (4H-Daily):
// - CHoCH Period: 50-100
// - ATR SL: 1.8, ATR TP: 2.7
// - EMA and MACD filters crucial
Expected Performance Improvements:
Win Rate: 55-70% (improved filtering)
Profit Factor: 2.0-3.5+ (better risk/reward with ATR)
Reduced Drawdown: Stricter filters reduce false signals
Consistent Risk: ATR-based stops adapt to volatility
This enhanced version provides much more robust signal filtering while maintaining the core market structure edge, resulting in higher-probability trades with consistent risk management.

SMT Divergence x outofoptions🔍 SMT Divergence — Advanced Market Correlation Analysis
This was created with and approved by @outofoptions to bring you smaller SMTs based on his original SMT Divergence indicator
SMT Divergence is a sophisticated technical analysis indicator designed to identify high-probability reversal and continuation signals through intelligent correlation analysis between related markets. This powerful tool reveals hidden market dynamics by comparing price action divergences across correlated instruments, providing traders with institutional-level market insight.
🎯 Core Capabilities:
Multi-Market Analysis : Automatically compares your chart with a correlated instrument to identify divergence patterns and market inefficiencies
Smart Liquidity Detection : Advanced algorithms identify key liquidity levels and sweep patterns for enhanced signal accuracy
Dynamic Divergence Mapping : Real-time visualization of bullish and bearish divergences with customizable line styles and colors
Intelligent Signal Validation : Optional candle-based confirmation system to filter high-probability setups from noise
Automated Line Management : Smart removal of invalidated divergences to maintain clean, actionable chart analysis
📊 Professional Features:
The SMT Divergence indicator excels at revealing market structure imbalances that often precede significant price movements. By analyzing the relationship between correlated markets, it identifies when institutional money may be positioned differently than retail sentiment suggests, providing early warning signals for potential reversals.
⚙️ Advanced Customization:
Flexible correlation pair selection for any market combination
Customizable visual styling with multiple line types and color schemes
Adjustable validation criteria for different trading styles
Professional alert system with detailed message customization
Automatic cleanup of broken or invalidated divergences
🎨 Visual Excellence:
Clean, professional line drawing with customizable styling
Dynamic labeling system with size and color options
Real-time divergence tracking and management
Institutional-grade chart presentation
Optimized performance for extended analysis periods
📈 Ideal For:
Swing traders seeking high-probability reversal signals
Multi-market analysts comparing correlated instruments
Institutional-style traders using correlation analysis
Advanced technical analysts studying market structure
Those seeking early warning signals for trend changes
🔔 Smart Alerts:
Comprehensive alert system with customizable messaging allows you to stay informed of new divergences across multiple timeframes and market sessions, ensuring you never miss critical market developments.
💡 Market Intelligence:
SMT Divergence transforms complex inter-market relationships into clear, actionable signals, giving you the same analytical edge used by professional trading institutions to identify market turning points before they become obvious to retail traders.
Educational Tool: This indicator is designed for educational and analytical purposes. Divergence analysis requires understanding of market correlation principles. Always combine with proper risk management and additional analysis methods.

ICT IRL & ERL ZonesICT IRL & ERL Zones
This indicator visualizes Internal Range Liquidity (IRL) and External Range Liquidity (ERL) levels, based on ICT (Inner Circle Trader) concepts. It's designed to help traders identify key liquidity zones that often act as magnet levels or reversal points in price action.
🔍 How It Works
Lookback Range: The script analyzes the highest high and lowest low over a user-defined number of candles (default: 50).
IRL (Internal Range Liquidity):
Plots the highest high and lowest low within the lookback period.
Represented as orange lines and a shaded zone.
ERL (External Range Liquidity):
Extends the IRL boundaries by a small buffer (50 ticks above/below).
Visualizes zones where price may reach for liquidity beyond the current range.
Plotted as a green (high) and red (low) line.
⚙️ Inputs
Lookback Range: Number of candles to calculate the range (min 5).
Show IRL: Toggle visibility for Internal Range Liquidity zone.
Show ERL: Toggle visibility for External Range Liquidity buffer zone.
📊 Visual Elements
IRL High/Low: Orange lines with fill to mark the main liquidity range.
ERL High/Low: Green and red lines indicating potential liquidity sweep zones.
Zone Fill: Light orange shading to visually emphasize the IRL area.
📈 Use Case
Use this tool to:
Identify areas where price might consolidate or reverse.
Highlight likely zones of liquidity grabs before trend continuations or shifts.
Enhance entry/exit decisions based on smart money concepts.

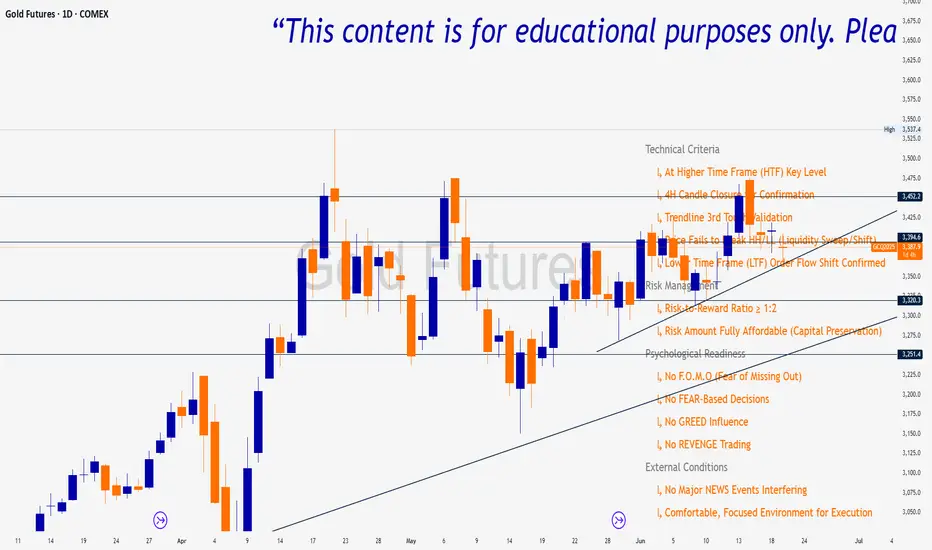
Trade Insight Entry Check List📌 Trade Insight™ Entry Checklist Indicator
This indicator is designed for Smart Money Concepts (SMC) and Price Action traders who prioritize precision, patience, and psychological discipline.
It helps you validate your trade setup across four essential categories before execution:
🔍 Technical Criteria
✅ Higher Time Frame (HTF) Key Level respected
✅ 4H Candle Closure Confirmation
✅ Trendline 3rd Touch Validation
✅ Liquidity Sweep or Shift (price fails to break HH/LL)
✅ Lower Time Frame (LTF) Order Flow Shift Confirmed
💰 Risk Management
✅ Risk-to-Reward Ratio ≥ 1:2
✅ Risk Amount Fully Affordable (Capital Preservation mindset)
🧠 Psychological Readiness
✅ No F.O.M.O (Fear of Missing Out)
✅ No FEAR-based decisions
✅ No GREED influence
✅ No REVENGE trading
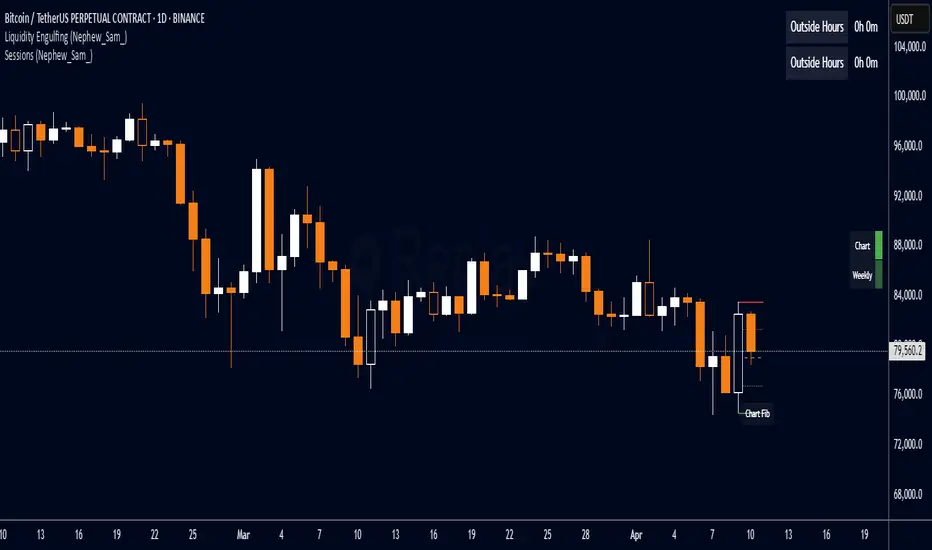
Liquidity Engulfing (Nephew_Sam_)🔥 Liquidity Engulfing Multi-Timeframe Detector
This indicator finds engulfing bars which have swept liquidity from its previous candle. You can use it across 6 timeframes with fibonacci entries.
⚡ Key Features
6 Customizable Timeframes - Complete market structure analysis
Smart Liquidity Detection - Finds patterns that sweep liquidity then reverse
Real-Time Status Table - Confirmed vs unconfirmed patterns with color coding
Fibonacci Integration - 5 customizable fib levels for precise entries
HTF → LTF Strategy - Spot reversals on higher timeframes, enter on lower timeframe fibs
📈 Engulfing Rules
Bullish: Current candle bullish + previous bearish + current low < previous low + current close > previous open
Bearish: Current candle bearish + previous bullish + current high > previous high + current close < previous open
MirPapa_Library_ICTLibrary "MirPapa_Library_ICT"
GetHTFoffsetToLTFoffset(_offset, _chartTf, _htfTf)
GetHTFoffsetToLTFoffset
@description Adjust an HTF offset to an LTF offset by calculating the ratio of timeframes.
Parameters:
_offset (int) : int The HTF bar offset (0 means current HTF bar).
_chartTf (string) : string The current chart’s timeframe (e.g., "5", "15", "1D").
_htfTf (string) : string The High Time Frame string (e.g., "60", "1D").
@return int The corresponding LTF bar index. Returns 0 if the result is negative.
IsConditionState(_type, _isBull, _level, _open, _close, _open1, _close1, _low1, _low2, _low3, _low4, _high1, _high2, _high3, _high4)
IsConditionState
@description Evaluate a condition state based on type for COB, FVG, or FOB.
Overloaded: first signature handles COB, second handles FVG/FOB.
Parameters:
_type (string) : string Condition type ("cob", "fvg", "fob").
_isBull (bool) : bool Direction flag: true for bullish, false for bearish.
_level (int) : int Swing level (only used for COB).
_open (float) : float Current bar open price (only for COB).
_close (float) : float Current bar close price (only for COB).
_open1 (float) : float Previous bar open price (only for COB).
_close1 (float) : float Previous bar close price (only for COB).
_low1 (float) : float Low 1 bar ago (only for COB).
_low2 (float) : float Low 2 bars ago (only for COB).
_low3 (float) : float Low 3 bars ago (only for COB).
_low4 (float) : float Low 4 bars ago (only for COB).
_high1 (float) : float High 1 bar ago (only for COB).
_high2 (float) : float High 2 bars ago (only for COB).
_high3 (float) : float High 3 bars ago (only for COB).
_high4 (float) : float High 4 bars ago (only for COB).
@return bool True if the specified condition is met, false otherwise.
IsConditionState(_type, _isBull, _pricePrev, _priceNow)
IsConditionState
@description Evaluate FVG or FOB condition based on price movement.
Parameters:
_type (string) : string Condition type ("fvg", "fob").
_isBull (bool) : bool Direction flag: true for bullish, false for bearish.
_pricePrev (float) : float Previous price (for FVG/FOB).
_priceNow (float) : float Current price (for FVG/FOB).
@return bool True if the specified condition is met, false otherwise.
IsSwingHighLow(_isBull, _level, _open, _close, _open1, _close1, _low1, _low2, _low3, _low4, _high1, _high2, _high3, _high4)
IsSwingHighLow
@description Public wrapper for isSwingHighLow.
Parameters:
_isBull (bool) : bool Direction flag: true for bullish, false for bearish.
_level (int) : int Swing level (1 or 2).
_open (float) : float Current bar open price.
_close (float) : float Current bar close price.
_open1 (float) : float Previous bar open price.
_close1 (float) : float Previous bar close price.
_low1 (float) : float Low 1 bar ago.
_low2 (float) : float Low 2 bars ago.
_low3 (float) : float Low 3 bars ago.
_low4 (float) : float Low 4 bars ago.
_high1 (float) : float High 1 bar ago.
_high2 (float) : float High 2 bars ago.
_high3 (float) : float High 3 bars ago.
_high4 (float) : float High 4 bars ago.
@return bool True if swing condition is met, false otherwise.
AddBox(_left, _right, _top, _bot, _xloc, _colorBG, _colorBD)
AddBox
@description Draw a rectangular box on the chart with specified coordinates and colors.
Parameters:
_left (int) : int Left bar index for the box.
_right (int) : int Right bar index for the box.
_top (float) : float Top price coordinate for the box.
_bot (float) : float Bottom price coordinate for the box.
_xloc (string) : string X-axis location type (e.g., xloc.bar_index).
_colorBG (color) : color Background color for the box.
_colorBD (color) : color Border color for the box.
@return box Returns the created box object.
Addline(_x, _y, _xloc, _color, _width)
Addline
@description Draw a vertical or horizontal line at specified coordinates.
Parameters:
_x (int) : int X-coordinate for start (bar index).
_y (int) : float Y-coordinate for start (price).
_xloc (string) : string X-axis location type (e.g., xloc.bar_index).
_color (color) : color Line color.
_width (int) : int Line width.
@return line Returns the created line object.
Addline(_x, _y, _xloc, _color, _width)
Parameters:
_x (int)
_y (float)
_xloc (string)
_color (color)
_width (int)
Addline(_x1, _y1, _x2, _y2, _xloc, _color, _width)
Parameters:
_x1 (int)
_y1 (int)
_x2 (int)
_y2 (int)
_xloc (string)
_color (color)
_width (int)
Addline(_x1, _y1, _x2, _y2, _xloc, _color, _width)
Parameters:
_x1 (int)
_y1 (int)
_x2 (int)
_y2 (float)
_xloc (string)
_color (color)
_width (int)
Addline(_x1, _y1, _x2, _y2, _xloc, _color, _width)
Parameters:
_x1 (int)
_y1 (float)
_x2 (int)
_y2 (int)
_xloc (string)
_color (color)
_width (int)
Addline(_x1, _y1, _x2, _y2, _xloc, _color, _width)
Parameters:
_x1 (int)
_y1 (float)
_x2 (int)
_y2 (float)
_xloc (string)
_color (color)
_width (int)
AddlineMid(_type, _left, _right, _top, _bot, _xloc, _color, _width)
AddlineMid
@description Draw a midline between top and bottom for FVG or FOB types.
Parameters:
_type (string) : string Type identifier: "fvg" or "fob".
_left (int) : int Left bar index for midline start.
_right (int) : int Right bar index for midline end.
_top (float) : float Top price of the region.
_bot (float) : float Bottom price of the region.
_xloc (string) : string X-axis location type (e.g., xloc.bar_index).
_color (color) : color Line color.
_width (int) : int Line width.
@return line or na Returns the created line or na if type is not recognized.
GetHtfFromLabel(_label)
GetHtfFromLabel
@description Convert a Korean HTF label into a Pine Script timeframe string via handler library.
Parameters:
_label (string) : string The Korean label (e.g., "5분", "1시간").
@return string Returns the corresponding Pine Script timeframe (e.g., "5", "60").
IsChartTFcomparisonHTF(_chartTf, _htfTf)
IsChartTFcomparisonHTF
@description Determine whether a given HTF is greater than or equal to the current chart timeframe.
Parameters:
_chartTf (string) : string Current chart timeframe (e.g., "5", "15", "1D").
_htfTf (string) : string HTF timeframe (e.g., "60", "1D").
@return bool True if HTF ≥ chartTF, false otherwise.
CreateBoxData(_type, _isBull, _useLine, _top, _bot, _xloc, _colorBG, _colorBD, _offset, _htfTf, htfBarIdx, _basePoint)
CreateBoxData
@description Create and draw a box and optional midline for given type and parameters. Returns success flag and BoxData.
Parameters:
_type (string) : string Type identifier: "fvg", "fob", "cob", or "sweep".
_isBull (bool) : bool Direction flag: true for bullish, false for bearish.
_useLine (bool) : bool Whether to draw a midline inside the box.
_top (float) : float Top price of the box region.
_bot (float) : float Bottom price of the box region.
_xloc (string) : string X-axis location type (e.g., xloc.bar_index).
_colorBG (color) : color Background color for the box.
_colorBD (color) : color Border color for the box.
_offset (int) : int HTF bar offset (0 means current HTF bar).
_htfTf (string) : string HTF timeframe string (e.g., "60", "1D").
htfBarIdx (int) : int HTF bar_index (passed from HTF request).
_basePoint (float) : float Base point for breakout checks.
@return tuple(bool, BoxData) Returns a boolean indicating success and the created BoxData struct.
ProcessBoxDatas(_datas, _useMidLine, _closeCount, _colorClose)
ProcessBoxDatas
@description Process an array of BoxData structs: extend, record volume, update stage, and finalize boxes.
Parameters:
_datas (array) : array Array of BoxData objects to process.
_useMidLine (bool) : bool Whether to update the midline endpoint.
_closeCount (int) : int Number of touches required to close the box.
_colorClose (color) : color Color to apply when a box closes.
@return void No return value; updates are in-place.
BoxData
Fields:
_isActive (series bool)
_isBull (series bool)
_box (series box)
_line (series line)
_basePoint (series float)
_boxTop (series float)
_boxBot (series float)
_stage (series int)
_isStay (series bool)
_volBuy (series float)
_volSell (series float)
_result (series string)
LineData
Fields:
_isActive (series bool)
_isBull (series bool)
_line (series line)
_basePoint (series float)
_stage (series int)
_isStay (series bool)
_result (series string)

Apex Edge SMC Tactical Suite
🛰 Apex Edge SMC Tactical Suite
Apex Edge SMC Tactical Suite is a precision-engineered multi-signal tool designed for advanced traders who demand real-time edge detection, breakout identification, and smart volatility-based risk placement. Built to blend seamlessly into any price action, SMC, or momentum-based strategy.
🔧 Core Features:
📍 Entry Signals
Green & red arrows appear only when a candle meets strict "Power Candle" criteria:
High momentum breakout
Volume spike confirmation
OBV spike divergence
Trend & HTF filter optional
Volatility-adjusted stop placement
💥 Power Candles
Smart detection of explosive volume+range candles
Custom "fuel score" system ranks their momentum potential
Displays as either candle highlights or subtle labels
📊 Fuel Meter
RSI-based energy tracker with customizable threshold
Plots real-time bar strength on a mini histogram
🧠 Trap Detection + Reversals
Detects stop hunt wicks or "liquidity traps"
Shows reversal diamonds on potential reclaim setups
Built-in swing logic confirms trap reversals
🧮 HTF Filtering
Optional higher-timeframe trend filter via Hull MA
Keeps signals aligned with broader market direction
📦 TP/SL Zones
Risk is calculated using volatility clustering (recent swing zones)
TP auto-calculated using ATR-based expansion
🔔 Alerts Included:
✅ Power Candle Detection
✅ Long/Short Entry Alerts
✅ Exit Signal Alerts
✅ Trap Defense Alerts
✅ Trap Reversal Confirmations
🎯 Ideal For:
SMC / ICT traders
Breakout traders
Trend followers
Scalpers / intraday setups
Momentum + volume combo traders
⚠️ Tip: Best paired with clean chart layouts, market structure, or order block frameworks. Can be combined with internal/external liquidity sweep logic for extra confluence.
Feel free to play around with the code and if you're a professional coder (unlike me) then please tag me into any versions that you can make better. Enjoy!
Disclaimer - This script was created entirely with many hours using the assistance of ChatGPT

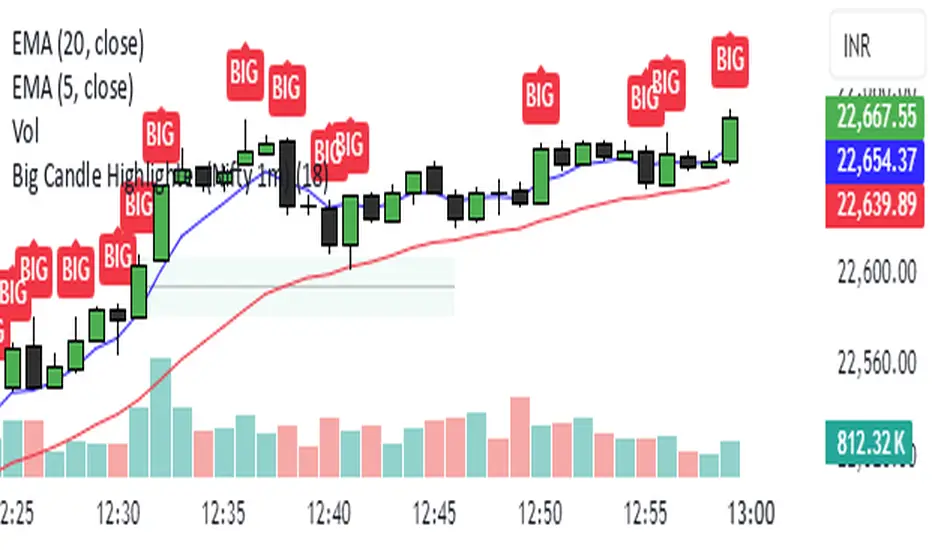
Big Candle Highlighter (Nifty 1m)This indicator will help option buyers to avoid taking trade in impulsive candles.
For Example :
Normal 1m candle: ~10–15 pts
Big candle (possible liquidity/impulse): >18 pts
Very large / avoid chasing: >25 pts
If you see a candle that breaks structure with a 25-30 point range and closes strong, it’s often:
A liquidity sweep
A news spike
Or the start of an impulsive leg — in which case entering at close can be risky without a retest
ICT Judas + Silver Bullet🔰 ICT Judas + Silver Bullet Indicator (SMC-based)
Built for Prop Firm and High Win Rate Intraday Traders
This indicator identifies key institutional setups from Inner Circle Trader (ICT) and Smart Money Concepts (SMC) strategies, optimized for XAUUSD, EURUSD, and other high-volume pairs on the 5-minute chart.
📌 Core Features:
✅ Asian Range Box (02:00–08:00 SGT) – used as manipulation anchor
✅ London Killzone (14:00–16:00 SGT) – Judas Swing detection
✅ New York Killzone (22:30–23:30 SGT) – Silver Bullet setups
✅ Automatic Fair Value Gap (FVG) detection
✅ Liquidity sweep detection based on 20-bar EQH/EQL
✅ Entry + Stop Loss + Take Profit visualization with adjustable RR
✅ Alerts for Judas and Silver setups
✅ Perfect for prop firm scalping and intraday swing logic
🛠️ How It Works:
- Judas Swing: triggers when liquidity above the Asian high is swept during London Killzone
- Silver Bullet: triggers when liquidity below recent lows is swept during NY Killzone
- Entry shown via circle, SL and TP lines based on user-defined RR and stop-loss pip distance
- Designed to be paired with SMC/ICT OB/FVG confirmation entries
⚙️ Settings:
- Adjustable session times
- Toggle FVG display
- Set RR and SL pips to match prop firm rules
- Compatible with alert webhooks for Telegram
🕰️ Note:
All times are fixed to **SGT (GMT+8)**. If you're in another timezone, adjust your TradingView timezone accordingly or update the session inputs manually during Daylight Saving Time changes.
🔔 Alert-Ready:
Use alerts for live signals and pair with webhooks for automation.
🔍 Recommended Pairings:
XAUUSD, EURUSD, GBPUSD, NAS100 on M5 chart
📈 Win Rate Potential:
Backtested with high-probability setups aligned with prop firm daily goals. Best used with strict discipline and 1-2 setups per day.
—
Built with ❤️ by a trader, for traders looking for precision-based executions using ICT logic.

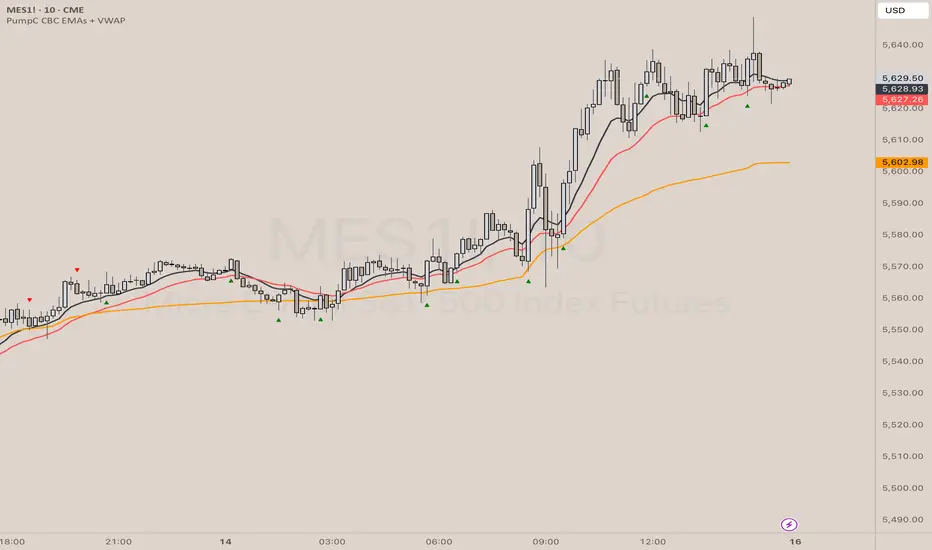
PumpC CBC EMAs + VWAPPumpC CBC EMAs + VWAP Indicator for Tradingview
Introduction
This is an indicator for the Candle By Candle (CBC) Flip strategy , based on the CBC Flip concept taught by MapleStax and inspired by the original CBC Flip indicator by AsiaRoo . The CBC Flip strategy is a simple yet effective approach to gauge if bulls or bears are in control for any given candle.
The logic behind the CBC Flip is as follows:
Bullish Flip : If the most recent candle’s close is above the previous candle’s high, bulls have taken control.
Bearish Flip : If the most recent candle’s close is below the previous candle’s low, bears are now in control.
No Flip : If neither condition is met, the previously dominant side (bulls or bears) remains in control until one of these conditions is satisfied, flipping the market sentiment—hence the name CBC Flip .
The PumpC CBC EMAs + VWAP Indicator enhances this simple strategy by adding trend confirmation filters using EMAs and VWAP , along with time-restricted signal generation and fully customizable alerts.
What Does This Indicator Do?
The PumpC CBC EMAs + VWAP Indicator helps traders identify CBC Flips to spot potential trend continuations or reversals. It combines candlestick logic , trend filters , and time-based restrictions to provide high-probability trade signals.
CBC Flip Detection
Bullish Flip : Current close is above the previous candle’s high.
Bearish Flip : Current close is below the previous candle’s low.
Strict Flips : Require a liquidity sweep for higher accuracy.
All Flips : Looser conditions that generate more frequent signals.
EMA and VWAP Trend Confirmation (Optional)
This filter ensures that long signals only trigger when the Slow EMA is above the VWAP , confirming an upward trend. For short signals, the Slow EMA must be below the VWAP.
Time-Based Filtering
The indicator allows you to set a specific trading window (e.g., 9:00 AM to 3:00 PM), helping you avoid low-volume or high-risk periods.
Visual Labels and Alerts
Labels : Arrows (▲ for long and ▼ for short) mark CBC Flip points on the chart.
Alerts : Fully customizable notifications for each signal type, based on your chosen filters.
Key Features
CBC Flip Detection : Identify potential reversals and trend continuations.
Strict vs. All Flips : Choose between higher-accuracy strict flips or more frequent all flips.
EMA-to-VWAP Filter : Optional trend confirmation filter to reduce false signals.
Customizable EMAs and VWAP : Configure lengths and colors for visual clarity.
Time-Restricted Signals : Focus on your preferred trading session.
Custom Alerts : Notifications for long and short signals based on filter settings.
Credits and Inspiration
The CBC Flip strategy was created by MapleStax .
This indicator is inspired by the original CBC Flip indicator by AsiaRoo .
Additional enhancements include EMA-to-VWAP filtering , custom alerts , and time-restricted signal generation for a more comprehensive trading experience.
Risks and Disclaimer
This indicator is for educational purposes only and does not constitute financial advice.
Trading involves significant risk, and past performance does not guarantee future results. Always test this indicator in a simulated environment before live trading.
4H CRT (1AM and 5AM)This TradingView script is designed to assist traders in implementing the "4-Hour Candle Ranges Theory Strategy (CRT)" by identifying key levels and setups based on the 1am and 4am (5am) 4-hour candles. This strategy is particularly effective for trading high-volatility assets such as Gold, EUR/USD, NAS100, US30, and S&P500, with US30 showing a notably high win rate. Here's how the strategy works:
Key Features:
1. Marking 1am and 4am 4-Hour Candle Ranges
- The script highlights the high and low of the 1am 4-hour candle.
- It visually tracks whether the high or low of the 1am candle is taken out by the subsequent 4-hour candle (5am).
2. Entry Setup Rules
- Primary Setup: Wait for the high or low of the 1am candle to be taken out by the 5am candle. Once this sweep occurs, wait for a Market Structure Shift (MSS) on the lower time frame (15min) to confirm your entry.
- Secondary Setup: If the 5am candle fails to take out the high or low of the 1am candle, the setup focuses on the levels formed by the 5am candle.
3. Trade Execution on 15-Minute Timeframe
- The script supports a lower time frame (15min) view to identify MSS and fine-tune entries.
4. Rinse and Repeat
- This process can be applied daily for consistent opportunities across the specified assets.
Advantages:
- Provides clear visual markers for key levels based on the 4-hour candles.
- Automates level plotting, saving traders time and reducing manual errors.
- Integrates well with the 15-minute timeframe for precise entry triggers.
- Optimized for popular trading instruments, especially US30 for a higher probability of success.
This script simplifies the application of CRT by automating the process of identifying and marking critical levels, enabling traders to focus on executing high-probability setups effectively.
Created by Hamid (poraymanfx)

Previous Candle Sweep IndicatorThis script identifies candlesticks where the current candle's high is higher than the previous candle's high, and the current candle's low is lower than the previous candle's low. If both conditions are met, the candle's body is highlighted in blue on the chart, allowing traders to quickly spot these patterns.
Features:
Highlights candles with both higher highs and lower lows.
Uses clear visual cues (blue body) for easy identification.
Ideal for traders looking to identify specific volatility patterns or reversals.

SMC Order Block & Liquidity EntryThe SMC Order Block and Liquidity Trap Entry Strategy script uses Smart Money Concepts (SMC), which analyze institutional actions in the market, to assist traders in identifying high-probability trades. In order to help traders match their entry with institutional activity, this script highlights important regions of interest, including order blocks, liquidity zones, and indications for Break of Structure (BOS) or Change of Character (CHoCH).
The fundamental ideas of this approach, which focuses on regions where institutions frequently make sizable orders or sweep liquidity, are based on SMC principles. Order blocks, which are frequently important support or resistance zones when institutions are involved, are the final bullish or bearish candle before a significant price move in the other direction. There are liquidity zones that show where retail stop-loss orders build up (above recent highs or below recent lows), such as Buy-Side Liquidity (BSL) and Sell-Side Liquidity (SSL). Before changing the direction of the price, institutions could target these zones, giving traders possible chances.
The script depicts liquidity levels above or below recent highs and lows, automatically finds order blocks within a specified lookback time, and looks for BOS (a continuation signal) or CHoCH (a reversal signal). When liquidity retests inside an order block coincide with BOS or CHoCH circumstances, entry signals are produced. While short entries are triggered when the price breaks below the order block and SSL, long entry alerts are triggered when the price breaks above the order block and BSL.

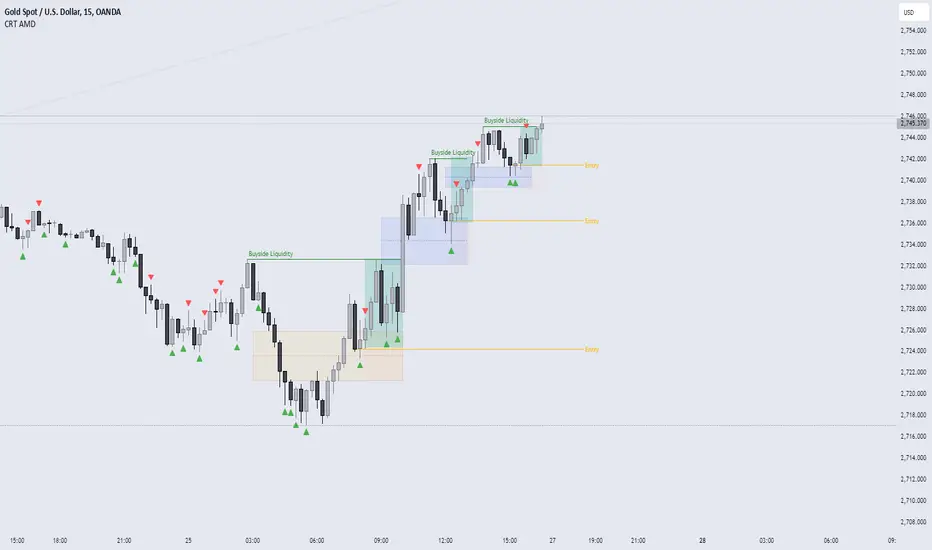
CRT AMD indicatorThis indicator is based on the Power of three (Accumulation Manipulation Distribution) Cycle, by marking the candle that Sweep the low or high of the previous candle and then closed back inside the range of the previous candle, indicating a possibility of a Manipulation or Reversal.
Combining the indicator with HTF Array and LTF Setup Entry will significantly improve the accuracy.
Smart Money Setup 07 [TradingFinder] Liquidity Hunts & Minor OB🔵 Introduction
The Smart Money Concept relies on analyzing market structure, tracking liquidity flows, and identifying order blocks. Research indicates that traders who apply these methods can improve their accuracy in predicting market movements by up to 30%.
These elements allow traders to understand the behavior of market makers, including banks and large financial institutions, which have the ability to influence price movements and shape major market trends. By recognizing how these entities operate, traders can align their strategies with Smart Money actions and better anticipate shifts in the market.
Smart Money typically enters the market at points of high liquidity where trading opportunities are more attractive. By following these liquidity flows, professional traders can position themselves at market reversal points, leading to profitable trades.
The Smart Money Setup 07 indicator has been specifically designed to detect these complex patterns. Using advanced algorithms, this indicator automatically identifies both bullish and bearish trading setups, assisting traders in discovering hidden market opportunities.
As a powerful technical analysis tool, the Smart Money Setup indicator helps predict the actions of major market participants and highlights optimal entry and exit points. Essentially, this tool enables traders to act like institutional investors and market makers, making the most of price fluctuations in their favor.
Ultimately, the Smart Money Setup 07 indicator transforms complex technical analysis into a simple and practical tool. By detecting order blocks and liquidity zones, this tool helps traders execute their strategies with greater precision, leading to more informed and successful trading decisions.
🟣 Bullish Setup
🟣 Bearish Setup
🔵 How to Use
One of the key strengths of the Smart Money Setup 07 indicator is its ability to accurately identify order blocks and analyze liquidity flows. Order blocks represent areas where large buy or sell orders are placed by Smart Money investors, which often indicate key reversal points in the market. Traders can use these order blocks to pinpoint potential entry and exit opportunities.
The Smart Money Setup indicator detects and visually displays these order blocks on the chart, helping traders identify the best zones to enter or exit trades. Since these zones are frequently used by large institutional investors, following these blocks allows traders to capitalize on price fluctuations and trade with confidence.
🟣 Bullish Smart Money Setup
A Bullish Smart Money Setup forms when the market creates Higher Lows and Higher Highs. In this situation, the indicator analyzes pivot points, liquidity flows, and order blocks to identify buy opportunities. Liquidity points in these setups indicate areas where Smart Money is likely to enter long positions.
In the bullish setup image, multiple Higher Lows and Higher Highs are formed. The green zone represents a Bullish Order Block, signaling traders to enter a long trade. The Smart Money Setup indicator displays a green arrow, indicating a high-probability upward price movement from this liquidity zone.
🟣 Bearish Smart Money Setup
A Bearish Smart Money Setup occurs when the market structure shows Lower Highs and Lower Lows, indicating weakness in price. The indicator identifies these patterns and highlights potential sell opportunities. Liquidity points in this setup mark areas where Smart Money enters sell positions.
In the bearish setup image, a Lower High is followed by a Lower Low, with the red liquidity zone acting as a Bearish Order Block. The Smart Money Setup indicator shows a red arrow, signaling a likely downward move, offering traders an opportunity to enter short positions.
🔵 Settings
Pivot Period : This setting determines how many candles are needed to form a pivot point. A default value of 2 is optimal for quickly identifying key pivot points in price action.
Order Block Validity Period : This parameter defines the lifespan of an order block. Traders can adjust how long each order block remains valid. For instance, setting it to 500 means that an order block will be valid for 500 bars after its formation.
Mitigation Level OB : This setting allows traders to select whether order blocks should be based on the "Proximal," "50% OB," or "Distal" levels, helping traders manage risk more effectively.
Order Block Refinement : Traders can refine the order blocks with precision. The indicator offers two refinement modes: Defensive and Aggressive. The Defensive mode identifies safer order blocks, while the Aggressive mode targets higher-risk blocks with the potential for larger reversals.
🔵 Conclusion
The Smart Money Setup 07 indicator is a powerful tool for identifying key Smart Money movements in the market. It provides traders with essential insights for making informed trading decisions, particularly when combined with technical analysis and liquidity flow analysis. This indicator allows traders to accurately pinpoint entry and exit points, helping them maximize profits and minimize risk.
By offering a range of customizable settings, the Smart Money Setup indicator adapts to different trading styles and strategies. Furthermore, its ability to detect order blocks and identify supply and demand zones makes it an indispensable tool for any trader looking to enhance their strategy.
In conclusion, the Smart Money Setup 07 is a crucial tool for traders aiming to optimize their trading performance. By utilizing the concepts of Smart Money in technical analysis, traders can make more precise decisions and take advantage of market fluctuations.

Swing Failure Pattern SFP [TradingFinder] SFP ICT Strategy🔵 Introduction
The Swing Failure Pattern (SFP), also referred to as a "Fake Breakout" or "False Breakout," is a vital concept in technical analysis. This pattern is derived from classic technical analysis, price action strategies, ICT concepts, and Smart Money Concepts.
It’s frequently utilized by traders to identify potential trend reversals in financial markets, especially in volatile markets like cryptocurrencies and forex. SFP helps traders recognize failed attempts to breach key support or resistance levels, providing strategic opportunities for trades.
The Swing Failure Pattern (SFP) is a popular strategy among traders used to identify false breakouts and potential trend reversals in the market. This strategy involves spotting moments where the price attempts to break above or below a previous high or low (breakout) but fails to sustain the move, leading to a sharp reversal.
Traders use this strategy to identify liquidity zones where stop orders (stop hunt) are typically placed and targeted by larger market participants or whales.
When the price penetrates these areas but fails to hold the levels, a liquidity sweep occurs, signaling exhaustion in the trend and a potential reversal. This strategy allows traders to enter the market at the right time and capitalize on opportunities created by false breakouts.
🟣 Types of SFP
When analyzing SFPs, two main variations are essential :
Real SFP : This occurs when the price breaks a critical level but fails to close above it, then quickly reverses. Due to its clarity and strong signal, this SFP type is highly reliable for traders.
Considerable SFP : In this scenario, the price closes slightly above a key level but quickly declines. Although significant, it is not as definitive or trustworthy as a Real SFP.
🟣 Understanding SFP
The Swing Failure Pattern, or False Breakout, is identified when the price momentarily breaks a crucial support or resistance level but cannot maintain the movement, leading to a rapid reversal.
The pattern can be categorized as follows :
Bullish SFP : This type occurs when the price dips below a support level but rebounds above it, signaling that sellers failed to push the price lower, indicating a potential upward trend.
Bearish SFP : This pattern forms when the price surpasses a resistance level but fails to hold, suggesting that buyers couldn’t maintain the higher price, leading to a potential decline.
🔵 How to Use
To effectively identify an SFP or Fake Breakout on a price chart, traders should follow these steps :
Identify Key Levels: Locate significant support or resistance levels on the chart.
Observe the Fake Breakout: The price should break the identified level but fail to close beyond it.
Monitor Price Reversal: After the breakout, the price should quickly reverse direction.
Execute the Trade: Traders typically enter the market after confirming the SFP.
🟣 Examples
Bullish Example : Bitcoin breaks below a $30,000 support level, drops to $29,000, but closes above $30,000 by the end of the day, signaling a Real Bullish SFP.
Bearish Example : Ethereum surpasses a $2,000 resistance level, rises to $2,100, but then falls back below $2,000, forming a Bearish SFP.
🟣 Pros and Cons of SFP
Pros :
Effective in identifying strong reversal points.
Offers a favorable risk-to-reward ratio.
Applicable across different timeframes.
Cons :
Requires experience and deep market understanding.
Risk of encountering false breakouts.
Should be combined with other technical tools for optimal effectiveness.
🔵 Settings
🟣 Logical settings
Swing period : You can set the swing detection period.
SFP Type : Choose between "All", "Real" and "Considerable" modes to identify the swing failure pattern.
Max Swing Back Method : It is in two modes "All" and "Custom". If it is in "All" mode, it will check all swings, and if it is in "Custom" mode, it will check the swings to the extent you determine.
Max Swing Back : You can set the number of swings that will go back for checking.
🟣 Display settings
Displaying or not displaying swings and setting the color of labels and lines.
🟣 Alert Settings
Alert SFP : Enables alerts for Swing Failure Pattern.
Message Frequency : Determines the frequency of alerts. Options include 'All' (every function call), 'Once Per Bar' (first call within the bar), and 'Once Per Bar Close' (final script execution of the real-time bar). Default is 'Once per Bar'.
Show Alert Time by Time Zone : Configures the time zone for alert messages. Default is 'UTC'.
🔵 Conclusion
The Swing Failure Pattern (SFP), or False Breakout, is an essential analytical tool that assists traders in identifying key market reversal points for successful trading.
By understanding the nuances between Real SFP and Considerable SFP, and integrating this pattern with other technical analysis tools, traders can make more informed decisions and better manage their trading risks.

ThePawnAlgoThe Pawn Algo is a simple indicator that is useful for scalping in sync with a higher timeframe should only be use in clear trending markets.
What it does and How it does it?
The script is based of a simple pattern close above previous candle high means higher prices we can see it in a green bar. Close below previous candle low means lower prices we can see it in a red bar. Close inside previous candle range means price is going to consolidate do some kind of retracement or reversal we mark it in a black or dark color bar.
It plot an arrow and a liquidity level when it detects a change in sentiment from bullish to bearish or bearish to bullish.
It plot the Higher timeframe previous completed candle range into the selected Lower timeframe to easily see the HTF levels into the lower timeframe.
The HTF range change colors depending of previous HTF candles closes following the same idea, close above previous candle high means green range, close below previous candle low means red range and close inside means a gray range. Finally it plots the 50% of the HTF range and the previous close high and low.
Finally it draws a yellow value zone that is the difference between the previous candle close and 50% of the previous range. This zone is ideal for taking continuation trades in favor of the HTF trend.
How to use it?
You must first select a higher timeframe in minutes in the settings default value is 1440minutes then select a lower timeframe is the maximum timeframe in where the HTF will be visible. Default lower timeframe is 15minutes.
Then just wait for the HTF candle to close and engage in the LTF when price is around the value yellow zone in a premium or discount.
Green arrows are automatically plot when HTF is bullish and Red arrows when is bearish by default. But you can enable or disable the arrow signals liquidity levels or configure as you want. Making all signals visible or just the buys or sells.
The script is useful to easily identify the HTF draw on liquidity and recent key levels and then use the LTF structure to enter.
The indicator can be used to identify liquidity, price will seek this liquidity point sometimes sweep and then continue the move. if the liquidity or stop level is broken with a body is a clear change of direction.

Gold & EUR/USD LTF liquidity Sweep + Market structure shift on a lower time frame for sniper entries

Reversal Pivot PointsThis indicator aims to identify price levels where price action has quickly reversed from. These "pivots" establish major levels where major liquidity is located. Unlike standard support and resistance levels, when price breaks below or above a pivot, these pivots disappear from the chart. Comes with various customization features built to fit all.
Features
Pivot Timeframe: Identify and plot pivots from one specific timeframe and see it from all lower timeframes
Pivot left/right bar limit: A feature aimed at preventing false pivots identification
Remove On Close (ROC): Feature to only remove pivots once price close under it
ROC Timeframe: The timeframe the script uses to determine if the candle closed under the level
Wait For Close: Will only remove the pivot after the current candle closes
Line Extension Type: The extension of the line. None - extends line to current time, left - only extends line to the left, right - only extends line to the right, both - extends line both directions
Line Offset: How much to offset (in bars) the line and label from the current candle
Line Type: The style of line when plotted. Solid (─), dotted (┈), dashed (╌), arrow left (←), arrow right (→), arrows both (↔)
Display Level: Whether to or not to display the price of the pivot
Display Perfect Level: Whether to or not to display levels where price perfectly rejected off of
Alerts: Creates an alert when a level has been crossed
How to trade
1. Pivots can be traded to or from. The stock market (market makers) will tend to "chase" liquidity in order to fill orders at better averages. This allows us retail traders to to participate alongside these moves to these pivots. Once price action hits a pivot, it can do two things: break the pivot and continue or bounce off it. We can participate alongside these bounces after confirmation of a reversal (doji, volume, etc). These bounce plays are high risk as it's generally 50-50, but the risk to reward is typically also very high, making them very valuable to take.
2. Typically, the market is a fluid environment and should be "natural," so perfect things (manmade and filled with liquidity) should not occur. With this knowledge, we can expect these perfect levels, "PDT/PDB," to break as they are not natural occurrence and have heavy liquidity on and above/below them. We can trade to these levels and expect them to break/sweep if price action comes near them again.
SMC Fake Zones + InsideBarThis indicator is useful for whom trade with "Smart Money Concept (SMC)" strategy.
It helps SMD traders to identify fake or weak zones in the chart, So they can avoid taking position in this zones.
This indicator marks "Asia session" as well as "London and New York's Lunch Time (one hour before London and NY session starts)" zones.
It also marks Inside Bar candles which SMC trades consider as order flow. You can mark every Inside Bar or only those with opposite color via setting options.
*** As we know in SMC rules
1- Supply and Demand zones in "Asia session and Lunch Times" are fake zones for SMC trading and price will engulf them in most of times.
2- "Asia session high and low" has huge liquidity and usually price sweep that in London session.
This indicator will helps traders to visually identify those Fake zones and Asia session liquidity.
* You can change session times based on your time zone in settings.
* You can set options to show all Inside Bars or only with Opposite color in settings.
