High Threshold Volume Bar
Core Concept
The indicator identifies "significant" price bars that stand out from normal market behavior by measuring:
Bar size (either full range or body)
Volume (optional)
Statistical significance compared to recent history
Trend context
Bar Color Meanings
Color 0 (Bright Blue): Represents high probability bullish signals. These appear when you have significant bars with upward price movement (close > open) that meet all criteria and have reached the minimum consecutive bar threshold.
Color 1 (Bright Pink): Represents high probability bearish signals. These appear when you have significant bars with downward price movement (close < open) that meet all criteria and have reached the minimum consecutive bar threshold.
Color 2 (Dark Teal): Represents significant bullish bars that meet the threshold criteria but haven't yet reached the minimum consecutive count requirement. These are potential early signals.
Color 3 (Dark Burgundy): Represents significant bearish bars that meet the threshold criteria but haven't yet reached the minimum consecutive count requirement. These are potential early signals.
Color 4 (Light Green): Represents normal bullish bars (close > open) that don't meet the significance threshold. These are standard market activity.
Color 5 (Light Red): Represents normal bearish bars (close < open) that don't meet the significance threshold. These are standard market activity.
When multiple criteria align, the indicator highlights potential high probability trading opportunities.
How to Use for Trade Entries
When to Consider Entries
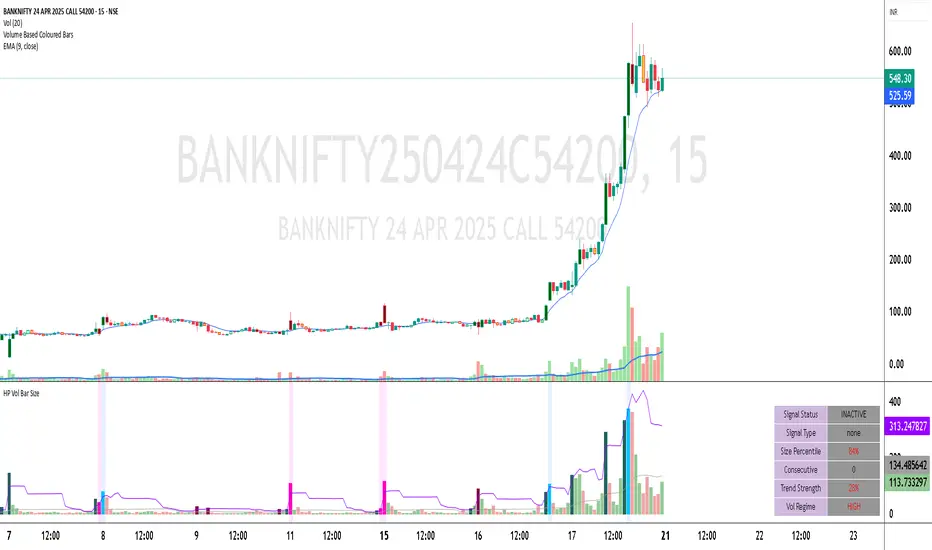
The indicator is most effective when:
(Image mentioned bottom right side of the chart)
Active Signal: The info table shows "ACTIVE" status
High Percentile: The current bar size is in the top 20% of recent bars (>80%)
Consecutive Count: At least your minimum consecutive significant bars have occurred
Strong Trend: Trend strength shows above 20%
Signal Types
The indicator classifies potential setups as:
Bullish Continuation: Strong upward move in an existing uptrend
Bearish Continuation: Strong downward move in an existing downtrend
Bullish Reversal: Strong upward move against a previous downtrend
Bearish Reversal: Strong downward move against a previous uptrend
Trading Approach
For Trend Following:
Enter on bullish_cont signals in uptrends
Enter on bearish_cont signals in downtrends
Use when volatility regime is "NORMAL" or "HIGH"
For Reversal Trading:
Look for bullish_rev signals at support levels
Look for bearish_rev signals at resistance levels
Particularly powerful when Size Percentile is >90%
For Volatility Expansion:
Enter when transitioning from "LOW" to "NORMAL" volatility
Consecutive count of 2-3 often indicates the start of a new move
Visual Signals(AS mentioned in image)
Bar Colors: Bright blue (bullish) or bright pink (bearish) for high probability signals
Background: Blue or pink highlights during significant zones
Table Data: Provides real-time context for the current bar
The indicator identifies "significant" price bars that stand out from normal market behavior by measuring:
Bar size (either full range or body)
Volume (optional)
Statistical significance compared to recent history
Trend context
Bar Color Meanings
Color 0 (Bright Blue): Represents high probability bullish signals. These appear when you have significant bars with upward price movement (close > open) that meet all criteria and have reached the minimum consecutive bar threshold.
Color 1 (Bright Pink): Represents high probability bearish signals. These appear when you have significant bars with downward price movement (close < open) that meet all criteria and have reached the minimum consecutive bar threshold.
Color 2 (Dark Teal): Represents significant bullish bars that meet the threshold criteria but haven't yet reached the minimum consecutive count requirement. These are potential early signals.
Color 3 (Dark Burgundy): Represents significant bearish bars that meet the threshold criteria but haven't yet reached the minimum consecutive count requirement. These are potential early signals.
Color 4 (Light Green): Represents normal bullish bars (close > open) that don't meet the significance threshold. These are standard market activity.
Color 5 (Light Red): Represents normal bearish bars (close < open) that don't meet the significance threshold. These are standard market activity.
When multiple criteria align, the indicator highlights potential high probability trading opportunities.
How to Use for Trade Entries
When to Consider Entries
The indicator is most effective when:
(Image mentioned bottom right side of the chart)
Active Signal: The info table shows "ACTIVE" status
High Percentile: The current bar size is in the top 20% of recent bars (>80%)
Consecutive Count: At least your minimum consecutive significant bars have occurred
Strong Trend: Trend strength shows above 20%
Signal Types
The indicator classifies potential setups as:
Bullish Continuation: Strong upward move in an existing uptrend
Bearish Continuation: Strong downward move in an existing downtrend
Bullish Reversal: Strong upward move against a previous downtrend
Bearish Reversal: Strong downward move against a previous uptrend
Trading Approach
For Trend Following:
Enter on bullish_cont signals in uptrends
Enter on bearish_cont signals in downtrends
Use when volatility regime is "NORMAL" or "HIGH"
For Reversal Trading:
Look for bullish_rev signals at support levels
Look for bearish_rev signals at resistance levels
Particularly powerful when Size Percentile is >90%
For Volatility Expansion:
Enter when transitioning from "LOW" to "NORMAL" volatility
Consecutive count of 2-3 often indicates the start of a new move
Visual Signals(AS mentioned in image)
Bar Colors: Bright blue (bullish) or bright pink (bearish) for high probability signals
Background: Blue or pink highlights during significant zones
Table Data: Provides real-time context for the current bar
Script su invito
Solo gli utenti autorizzati dall'autore hanno accesso a questo script e ciò richiede solitamente un pagamento. Puoi aggiungere lo script ai tuoi preferiti, ma potrai utilizzarlo solo dopo aver richiesto l'autorizzazione e averla ottenuta dal suo autore - per saperne di più leggi qui. Per maggiori dettagli, segui le istruzioni dell'autore qui sotto o contatta direttamente SanttoshPDani.
TradingView NON consiglia di pagare o utilizzare uno script a meno che non ci si fidi pienamente del suo autore e non si comprenda il suo funzionamento. Puoi anche trovare alternative gratuite e open-source nei nostri script della comunità.
Istruzioni dell'autore
Attenzione: prima di richiedere l'accesso, leggi la nostra guida per gli script su invito.
Declinazione di responsabilità
Script su invito
Solo gli utenti autorizzati dall'autore hanno accesso a questo script e ciò richiede solitamente un pagamento. Puoi aggiungere lo script ai tuoi preferiti, ma potrai utilizzarlo solo dopo aver richiesto l'autorizzazione e averla ottenuta dal suo autore - per saperne di più leggi qui. Per maggiori dettagli, segui le istruzioni dell'autore qui sotto o contatta direttamente SanttoshPDani.
TradingView NON consiglia di pagare o utilizzare uno script a meno che non ci si fidi pienamente del suo autore e non si comprenda il suo funzionamento. Puoi anche trovare alternative gratuite e open-source nei nostri script della comunità.
Istruzioni dell'autore
Attenzione: prima di richiedere l'accesso, leggi la nostra guida per gli script su invito.