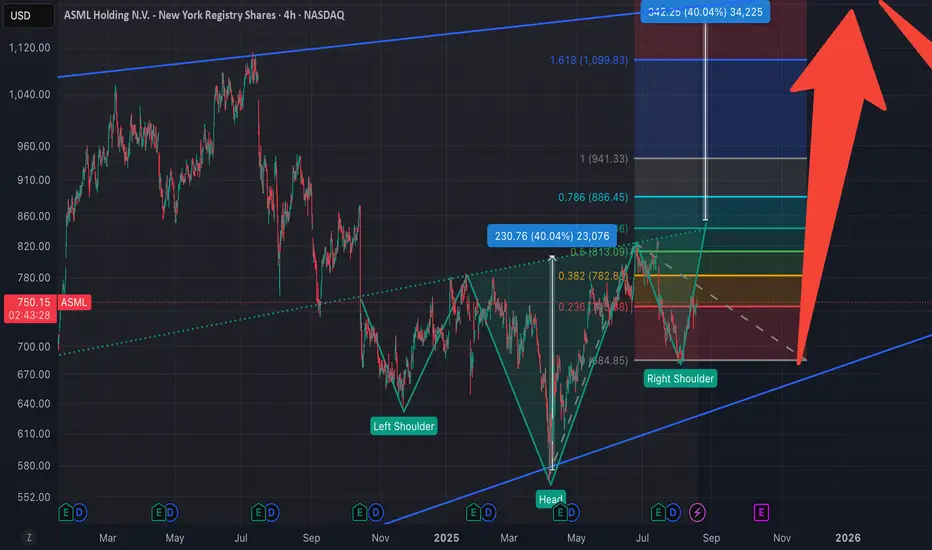
Based on the conjecture, the right shoulder is about to form. The head and shoulders bottom pattern will only complete upon a breakout above 840. If the price falls below the previous low (approximately 680), the conjecture fails. The projected rise from the head and shoulders bottom roughly aligns with the overhead resistance levels. The long-term chart pattern appears more like a wedge.
Short-term support: 68x
Short-term resistance: 84x
Target levels: 84x, 94x, 11xx
Short-term support: 68x
Short-term resistance: 84x
Target levels: 84x, 94x, 11xx
Declinazione di responsabilità
Le informazioni e le pubblicazioni non sono intese come, e non costituiscono, consulenza o raccomandazioni finanziarie, di investimento, di trading o di altro tipo fornite o approvate da TradingView. Per ulteriori informazioni, consultare i Termini di utilizzo.
Declinazione di responsabilità
Le informazioni e le pubblicazioni non sono intese come, e non costituiscono, consulenza o raccomandazioni finanziarie, di investimento, di trading o di altro tipo fornite o approvate da TradingView. Per ulteriori informazioni, consultare i Termini di utilizzo.