### **Symmetrical Triangle Breakout Analysis – Bharti Airtel Ltd (Weekly Chart)**
#### **1️⃣ Pattern Overview**
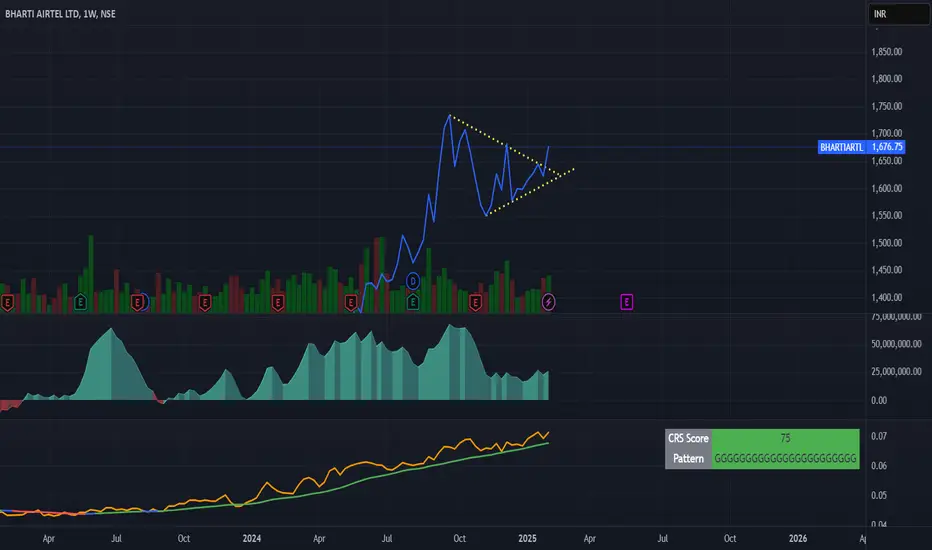
- A **Symmetrical Triangle** has formed after a strong **uptrend**, indicating a potential continuation.
- The price is **compressing within converging trendlines**, suggesting a breakout is near.
#### **2️⃣ Breakout Confirmation**
✅ **Bullish Scenario:**
- A **break and close above ₹1,700** with strong volume confirms an upside breakout.
- The breakout target is the **height of the triangle added to the breakout level** (estimated around **₹1,850 - ₹1,900**).
- RSI and **CRS Score of 75** indicate relative strength in the stock.
❌ **Bearish Scenario:**
- A **break below ₹1,600** with volume suggests a downside move.
- The price may test **₹1,450 - ₹1,400** if the breakdown is confirmed.
#### **3️⃣ Key Indicators to Watch**
📊 **Volume:** A spike in volume will confirm a strong breakout.
📉 **RSI & Momentum:** If RSI stays above 50, the bullish momentum remains intact.
🟢 **CRS Score (75):** Indicates stock is outperforming the market.
#### **4️⃣ Trade Plan**
📌 **Entry:** Buy above ₹1,700 after breakout confirmation.
📌 **Stop Loss:** Below ₹1,600 (previous support).
📌 **Target:** ₹1,850 - ₹1,900 for a bullish breakout.
🚀 **Final View:** **Stock is in a strong uptrend, and a breakout above ₹1,700 could trigger a big move. Keep an eye on volume and confirmation candle!**
#### **1️⃣ Pattern Overview**
- A **Symmetrical Triangle** has formed after a strong **uptrend**, indicating a potential continuation.
- The price is **compressing within converging trendlines**, suggesting a breakout is near.
#### **2️⃣ Breakout Confirmation**
✅ **Bullish Scenario:**
- A **break and close above ₹1,700** with strong volume confirms an upside breakout.
- The breakout target is the **height of the triangle added to the breakout level** (estimated around **₹1,850 - ₹1,900**).
- RSI and **CRS Score of 75** indicate relative strength in the stock.
❌ **Bearish Scenario:**
- A **break below ₹1,600** with volume suggests a downside move.
- The price may test **₹1,450 - ₹1,400** if the breakdown is confirmed.
#### **3️⃣ Key Indicators to Watch**
📊 **Volume:** A spike in volume will confirm a strong breakout.
📉 **RSI & Momentum:** If RSI stays above 50, the bullish momentum remains intact.
🟢 **CRS Score (75):** Indicates stock is outperforming the market.
#### **4️⃣ Trade Plan**
📌 **Entry:** Buy above ₹1,700 after breakout confirmation.
📌 **Stop Loss:** Below ₹1,600 (previous support).
📌 **Target:** ₹1,850 - ₹1,900 for a bullish breakout.
🚀 **Final View:** **Stock is in a strong uptrend, and a breakout above ₹1,700 could trigger a big move. Keep an eye on volume and confirmation candle!**
Declinazione di responsabilità
Le informazioni ed i contenuti pubblicati non costituiscono in alcun modo una sollecitazione ad investire o ad operare nei mercati finanziari. Non sono inoltre fornite o supportate da TradingView. Maggiori dettagli nelle Condizioni d'uso.
Declinazione di responsabilità
Le informazioni ed i contenuti pubblicati non costituiscono in alcun modo una sollecitazione ad investire o ad operare nei mercati finanziari. Non sono inoltre fornite o supportate da TradingView. Maggiori dettagli nelle Condizioni d'uso.