Summary
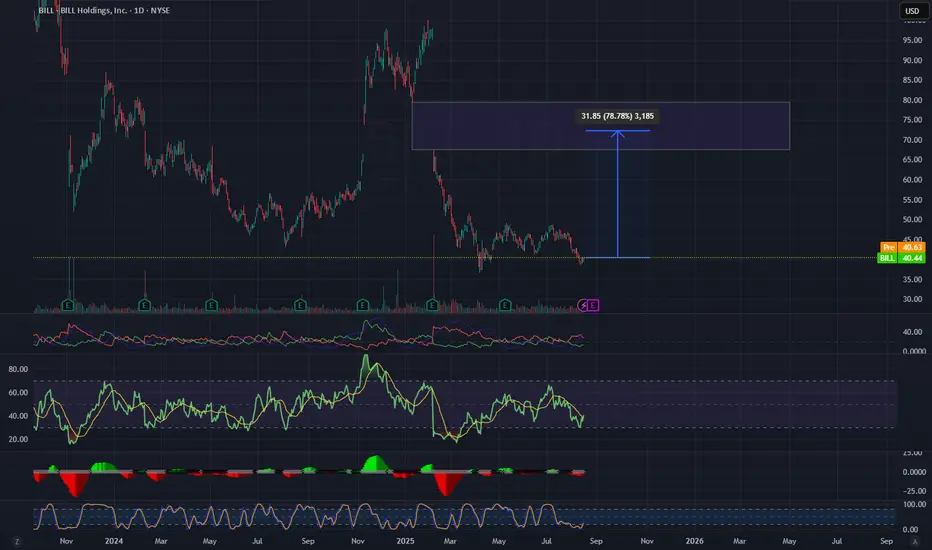
BILL has been in a prolonged downtrend, but the weekly chart suggests a potential reversal setup. Historically, after every major decline, the stock has staged a strong rebound. The current structure shows price testing a long-term support zone around $38–40. If buyers step in, BILL may begin building momentum toward filling the overhead gap around $75–80.
🔍 Technical Analysis
* Weekly Structure: BILL has retraced heavily from its highs near $220, now consolidating at multi-year support ($38–40). Historically, these deep retracements have preceded large recovery rallies.
* Gap Fill Potential: The most notable overhead gap lies between $75–80. If momentum shifts bullish, this area becomes a natural magnet.
* Indicators:
* RSI: Flattening near 40 on the weekly, suggesting downside pressure is slowing, leaving room for upside expansion.
* MACD: Momentum histogram beginning to contract on the downside, signaling bearish exhaustion and potential cross-over ahead.
* Stochastic: Oversold and starting to curl upward – a common signal ahead of reversal moves.
* ADX/DMI: Weakening bearish trend strength, creating conditions for a shift in momentum.
* Volume: Capitulation spikes were seen on prior selloffs; current volume profile suggests accumulation.
🎯 Trade Setup
Reversal Scenario
Entry: $39–41 (current long-term support).
Stop Loss: < $35 (below support and invalidation of reversal thesis).
Targets:
* T1: $50 (first swing resistance).
* T2: $62 (Fib 0.382 retracement).
* T3: $75–80 (gap-fill zone).
Alternative Scenario (Bearish Continuation)
If support at $38 breaks on strong volume, price could retest $30–32 as next support zone.
📈 Fundamental / Sentiment Context
* BILL operates in the fintech/payment automation sector, an industry under pressure but with long-term structural tailwinds.
* Market sentiment remains cautious, but BILL has surprised in the past with sharp recoveries once selling exhaustion sets in.
* Any earnings surprise, guidance upgrade, or sector momentum (e.g., fintech rebound) could act as a catalyst for a sharp upside rally.
✅ Execution Notes
* Position sizing should remain conservative until reversal confirmation.
* Watch weekly closes above $45–47 as an early sign of momentum shift.
* Partial profits can be taken at $50 and $62; leave runners for a potential gap-fill toward $75–80.
TL;DR
BILL is testing a multi-year support zone around $38–40 after a prolonged decline. Technicals point to bearish exhaustion with a high-probability setup for a reversal. Upside targets include $50 → $62 → $75–80 (gap fill). Breakdown below $35 invalidates the setup.
Declinazione di responsabilità
Le informazioni e le pubblicazioni non sono intese come, e non costituiscono, consulenza o raccomandazioni finanziarie, di investimento, di trading o di altro tipo fornite o approvate da TradingView. Per ulteriori informazioni, consultare i Termini di utilizzo.
Declinazione di responsabilità
Le informazioni e le pubblicazioni non sono intese come, e non costituiscono, consulenza o raccomandazioni finanziarie, di investimento, di trading o di altro tipo fornite o approvate da TradingView. Per ulteriori informazioni, consultare i Termini di utilizzo.