Hey guys, just made another research on the fractals of Bitcoin, and here is what I've found.
This chart represents similar price action look from 2013 price action approx from $2.00 to $160.00+ (x80)
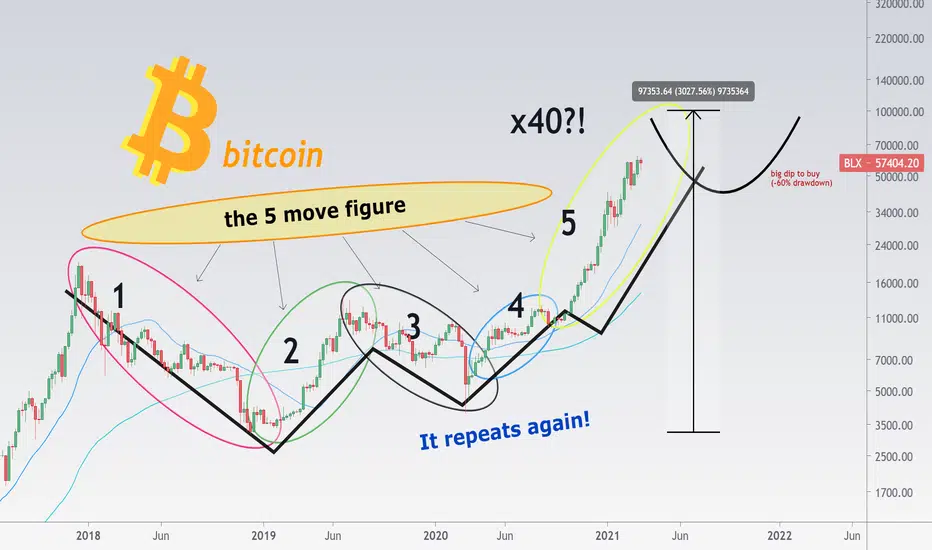
This move was made from 5 phases, where
Phase 1 - crash pattern
Phase 2 - rebound pattern
Phase 3 - consolidation
Phase 4 - recovery
Phase 5 - growth
2013 chart with all phases:

It is amazing how it looks compared to now! it is almost 100% same look and price action setups. Check it out
What is interesting is after 5-th phase, it comes into big dip (correction) with -60% drawdown. Then price pumped x5. Seems like it would be nice opportunity if price action during 2021/22 will repeat all this process in same manner. Hoping for best here!
Remember this is not trading setup, this chart is only a refference for Possbile market look.
Check my other Trading ideas for btc:


Thanks for attention,
Best regards
Artem Shevelev
This chart represents similar price action look from 2013 price action approx from $2.00 to $160.00+ (x80)
This move was made from 5 phases, where
Phase 1 - crash pattern
Phase 2 - rebound pattern
Phase 3 - consolidation
Phase 4 - recovery
Phase 5 - growth
2013 chart with all phases:
It is amazing how it looks compared to now! it is almost 100% same look and price action setups. Check it out
What is interesting is after 5-th phase, it comes into big dip (correction) with -60% drawdown. Then price pumped x5. Seems like it would be nice opportunity if price action during 2021/22 will repeat all this process in same manner. Hoping for best here!
Remember this is not trading setup, this chart is only a refference for Possbile market look.
Check my other Trading ideas for btc:
Thanks for attention,
Best regards
Artem Shevelev
Declinazione di responsabilità
Le informazioni e le pubblicazioni non sono intese come, e non costituiscono, consulenza o raccomandazioni finanziarie, di investimento, di trading o di altro tipo fornite o approvate da TradingView. Per ulteriori informazioni, consultare i Termini di utilizzo.
Declinazione di responsabilità
Le informazioni e le pubblicazioni non sono intese come, e non costituiscono, consulenza o raccomandazioni finanziarie, di investimento, di trading o di altro tipo fornite o approvate da TradingView. Per ulteriori informazioni, consultare i Termini di utilizzo.