📌 Current Price Context
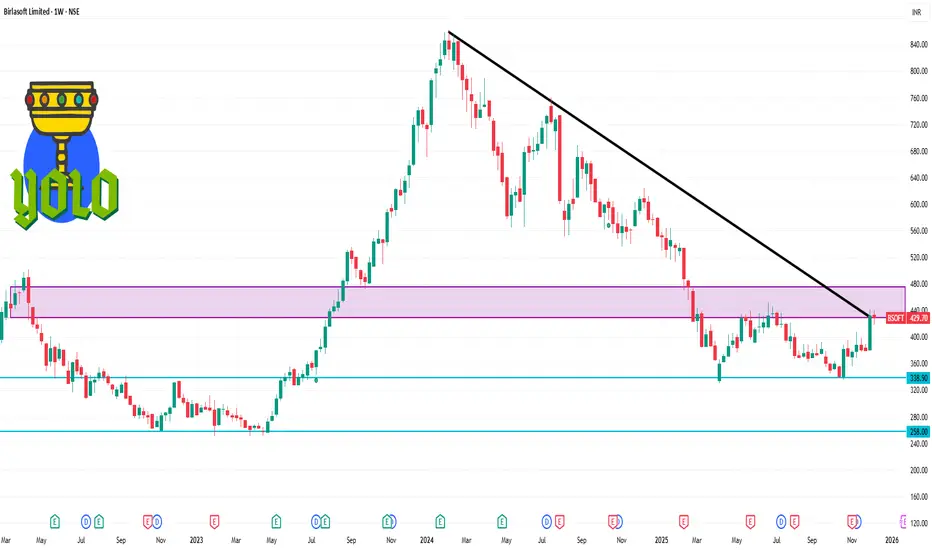
• Birlasoft is trading around ₹428–₹430 on NSE (Dec 12 2025).
• On a 1-week basis recently the price moved slightly down (~-0.7%).
📊 Short-Term Levels (1 Week / Swing Trading)
⚡ Immediate Support Levels
These are price zones where buyers may step in if the stock pulls back:
₹425–₹420 — first support zone (near current price cushion).
₹408–₹402 — deeper support zone if weakness extends.
~₹395 — third support level for risk-off moves.
If the price closes below ₹420 weekly, the short-term bias can turn bearish and more downside (toward ₹402–₹395) may unfold.
🚀 Resistance Levels to Watch
These are levels where the stock may struggle to break above:
₹430–₹434 — near current short-term resistance cluster.
₹438–₹443 — next resistance band above.
A clear weekly close above ₹434–₹438 would improve short-term bullish momentum.
📈 Technical Pattern Notes
Some charting interpretations from community and analysts suggest:
A double-bottom base around ₹330 with a neckline near ₹445–₹450, which is a bullish reversal pattern on higher timeframes. A breakout above ~₹450 could signal stronger upside continuation.
Pubblicazioni correlate
Declinazione di responsabilità
Le informazioni e le pubblicazioni non sono intese come, e non costituiscono, consulenza o raccomandazioni finanziarie, di investimento, di trading o di altro tipo fornite o approvate da TradingView. Per ulteriori informazioni, consultare i Termini di utilizzo.