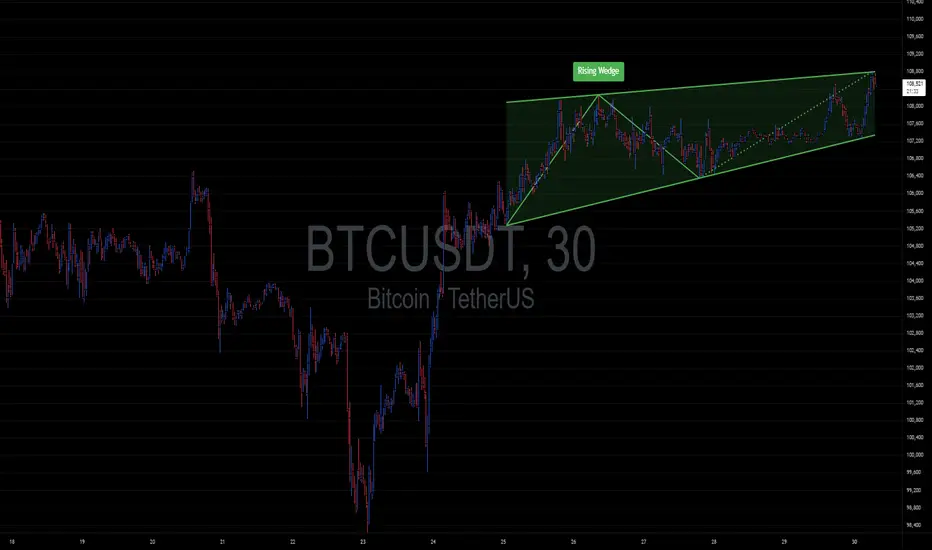
⚠️ Rising Wedge Formation Detected!
Bitcoin is currently moving within a clearly defined Rising Wedge—typically a bearish reversal pattern indicating possible exhaustion of upward momentum.
🔸 Upper Resistance Zone: ~$108,700 – $109,000
🔸 Lower Support Zone: ~$106,400 – $106,700
🟢 Bullish Scenario:
If price breaks upward decisively (high volume above $109K), it can invalidate the wedge and target $110K+.
🔴 Bearish Scenario (more likely):
If price loses the lower boundary (~$106.4K), expect accelerated selling pressure with potential downside targets near $105K–$104.5K.
Wait for clear breakout/breakdown confirmation before entering trades.
Declinazione di responsabilità
Le informazioni e le pubblicazioni non sono intese come, e non costituiscono, consulenza o raccomandazioni finanziarie, di investimento, di trading o di altro tipo fornite o approvate da TradingView. Per ulteriori informazioni, consultare i Termini di utilizzo.
Declinazione di responsabilità
Le informazioni e le pubblicazioni non sono intese come, e non costituiscono, consulenza o raccomandazioni finanziarie, di investimento, di trading o di altro tipo fornite o approvate da TradingView. Per ulteriori informazioni, consultare i Termini di utilizzo.