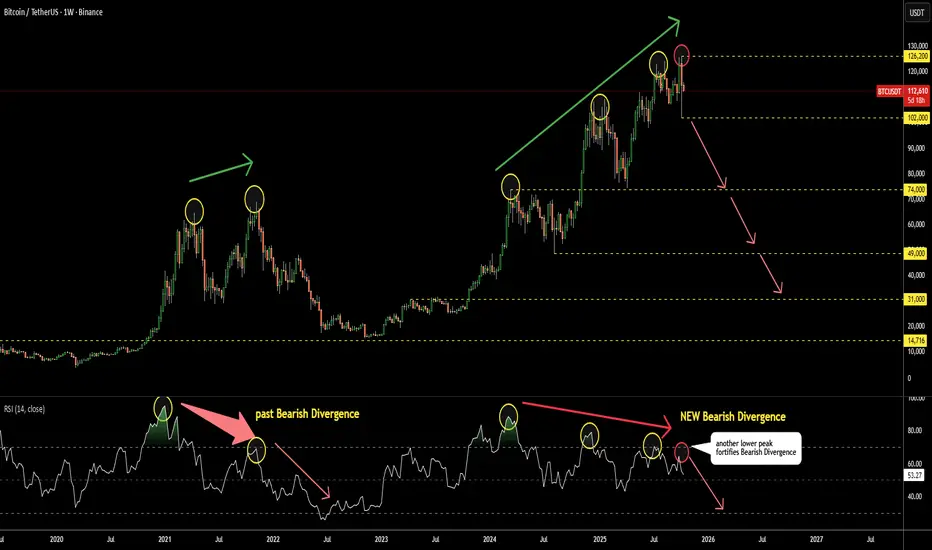
This is a brief update to the analysis shared in August. The RSI has now formed a fourth consecutive lower peak on the weekly chart, further confirming the bearish divergence.
Monitor the RSI closely — a break below 50 (currently at 53) could signal the onset of a bear market.
The first key support level is near 102K, and a decisive move below this level would strengthen the bearish outlook.
Monitor the RSI closely — a break below 50 (currently at 53) could signal the onset of a bear market.
The first key support level is near 102K, and a decisive move below this level would strengthen the bearish outlook.
Pubblicazioni correlate
Declinazione di responsabilità
Le informazioni ed i contenuti pubblicati non costituiscono in alcun modo una sollecitazione ad investire o ad operare nei mercati finanziari. Non sono inoltre fornite o supportate da TradingView. Maggiori dettagli nelle Condizioni d'uso.
Pubblicazioni correlate
Declinazione di responsabilità
Le informazioni ed i contenuti pubblicati non costituiscono in alcun modo una sollecitazione ad investire o ad operare nei mercati finanziari. Non sono inoltre fornite o supportate da TradingView. Maggiori dettagli nelle Condizioni d'uso.