✅ CESC – Multi-Timeframe Analysis Summary
1. Higher Time Frame (HTF) – Strong Uptrend
TF Zone Trend Analysis Proximal Distal Avg
Yearly Demand UP Rally–Rally 134 109 122
6 Month Demand UP Rally–Rally 134 109 122
Quarterly Demand UP Rally–Base–Rally 150 109 130
HTF Average — UP — 139 109 124
Interpretation:
HTF structure extremely strong. Very deep demand zone at 109–139. No HTF weakness.
2. Medium Time Frame (MTF) – Strong Uptrend with DMIP Demand
TF Trend Zone Proximal Distal Avg
Monthly UP DMIP 173 160 167
Weekly UP DMIP 158 152 155
Daily UP DMIP 157 152 155
MTF Average UP — 163 155 159
Interpretation:
Multiple DMIP demand zones clustered at 152–160, giving a very tight, high-probability support.
3. Intraday Time Frame (ITF) – Micro Demand Confirmation
TF Trend Zone Proximal Distal Avg
240m UP DMIP 153 152 153
180m UP DMIP 153 152 153
60m UP DMIP 153 152 153
ITF Average UP — 153 152 153
Interpretation:
Strong micro-level confirmation.
The stock is respecting the 152–153 pivot heavily.
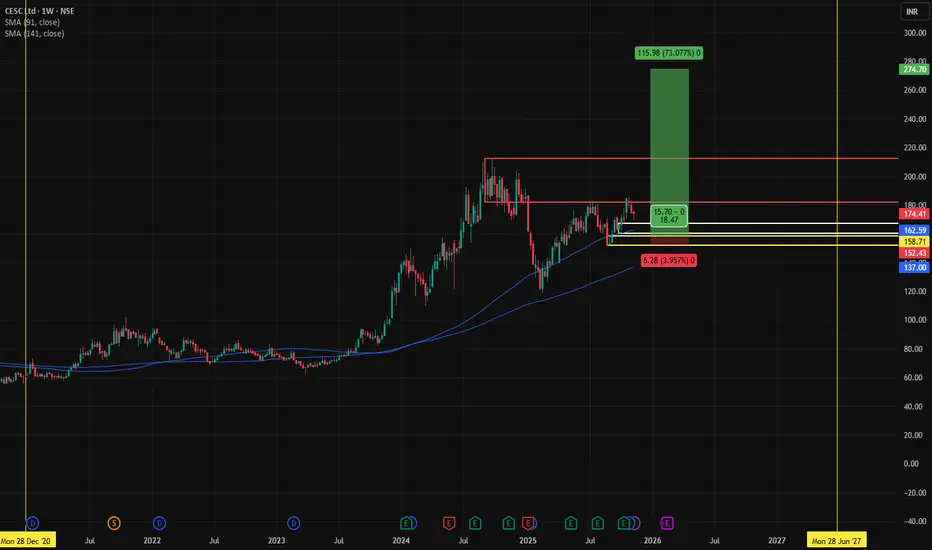
🎯 CESC Trade Plan
✔ Entry Plan
Entry-1 (High Probability): 173
Entry-2 (Value Buy): 158
Average Entry: 166
✔ Stop Loss
SL: 152
Total Risk per share: ₹21
🎯 Targets
First Target: 234
Positional Target: 273
Last High Supply: 183
Last High MTF: 212
Upside Potential: 273
Variance between High Demand & Supply: 61
📌 Risk–Reward / Financials
Position Size
Qty: 5000 shares
Total Buy Value: ₹8,27,500
Capital Required: ₹4,13,750 (MTF 50%)
Brokerage & Taxes
0.49% Transaction cost
Brokerage Value: ₹4,056
💰 Profit Analysis (If Target Hits)
Profit Booking
70% booking at first target → ₹1,98,250
30% booking at final target → ₹1,75,000
Total Gross Profit: ₹3,73,250
Net Profit (After charges): ₹3,69,194
❌ Loss Scenario (If SL Hits)
Loss: ₹1,05,000
Net Loss: ₹1,09,056
📊 Risk Reward
RR = 3.4
Net RR = 3.39
(Excellent for positional swing)
⏳ Real ROI Calculation (If Target Hits in 4 Months)
Interest Per Annum: 9.69%
Interest per day: 0.03%
Total Interest for 4 months: ₹40,092
Real Net Profit:
₹3,29,101 after interest deduction
Real ROI in 4 months:
🚀 80% return
🔥 Final View – CESC is a Strong BUY
Why?
All TFs from Yearly → Intraday aligned UP
Multiple DMIP demand zones at 152–160
Strong risk–reward (3.4 RR)
Targets are realistic (234 & 273)
Very high ROI potential
1. Higher Time Frame (HTF) – Strong Uptrend
TF Zone Trend Analysis Proximal Distal Avg
Yearly Demand UP Rally–Rally 134 109 122
6 Month Demand UP Rally–Rally 134 109 122
Quarterly Demand UP Rally–Base–Rally 150 109 130
HTF Average — UP — 139 109 124
Interpretation:
HTF structure extremely strong. Very deep demand zone at 109–139. No HTF weakness.
2. Medium Time Frame (MTF) – Strong Uptrend with DMIP Demand
TF Trend Zone Proximal Distal Avg
Monthly UP DMIP 173 160 167
Weekly UP DMIP 158 152 155
Daily UP DMIP 157 152 155
MTF Average UP — 163 155 159
Interpretation:
Multiple DMIP demand zones clustered at 152–160, giving a very tight, high-probability support.
3. Intraday Time Frame (ITF) – Micro Demand Confirmation
TF Trend Zone Proximal Distal Avg
240m UP DMIP 153 152 153
180m UP DMIP 153 152 153
60m UP DMIP 153 152 153
ITF Average UP — 153 152 153
Interpretation:
Strong micro-level confirmation.
The stock is respecting the 152–153 pivot heavily.
🎯 CESC Trade Plan
✔ Entry Plan
Entry-1 (High Probability): 173
Entry-2 (Value Buy): 158
Average Entry: 166
✔ Stop Loss
SL: 152
Total Risk per share: ₹21
🎯 Targets
First Target: 234
Positional Target: 273
Last High Supply: 183
Last High MTF: 212
Upside Potential: 273
Variance between High Demand & Supply: 61
📌 Risk–Reward / Financials
Position Size
Qty: 5000 shares
Total Buy Value: ₹8,27,500
Capital Required: ₹4,13,750 (MTF 50%)
Brokerage & Taxes
0.49% Transaction cost
Brokerage Value: ₹4,056
💰 Profit Analysis (If Target Hits)
Profit Booking
70% booking at first target → ₹1,98,250
30% booking at final target → ₹1,75,000
Total Gross Profit: ₹3,73,250
Net Profit (After charges): ₹3,69,194
❌ Loss Scenario (If SL Hits)
Loss: ₹1,05,000
Net Loss: ₹1,09,056
📊 Risk Reward
RR = 3.4
Net RR = 3.39
(Excellent for positional swing)
⏳ Real ROI Calculation (If Target Hits in 4 Months)
Interest Per Annum: 9.69%
Interest per day: 0.03%
Total Interest for 4 months: ₹40,092
Real Net Profit:
₹3,29,101 after interest deduction
Real ROI in 4 months:
🚀 80% return
🔥 Final View – CESC is a Strong BUY
Why?
All TFs from Yearly → Intraday aligned UP
Multiple DMIP demand zones at 152–160
Strong risk–reward (3.4 RR)
Targets are realistic (234 & 273)
Very high ROI potential
Declinazione di responsabilità
Le informazioni e le pubblicazioni non sono intese come, e non costituiscono, consulenza o raccomandazioni finanziarie, di investimento, di trading o di altro tipo fornite o approvate da TradingView. Per ulteriori informazioni, consultare i Termini di utilizzo.
Declinazione di responsabilità
Le informazioni e le pubblicazioni non sono intese come, e non costituiscono, consulenza o raccomandazioni finanziarie, di investimento, di trading o di altro tipo fornite o approvate da TradingView. Per ulteriori informazioni, consultare i Termini di utilizzo.