DOOOOM
LONG term...
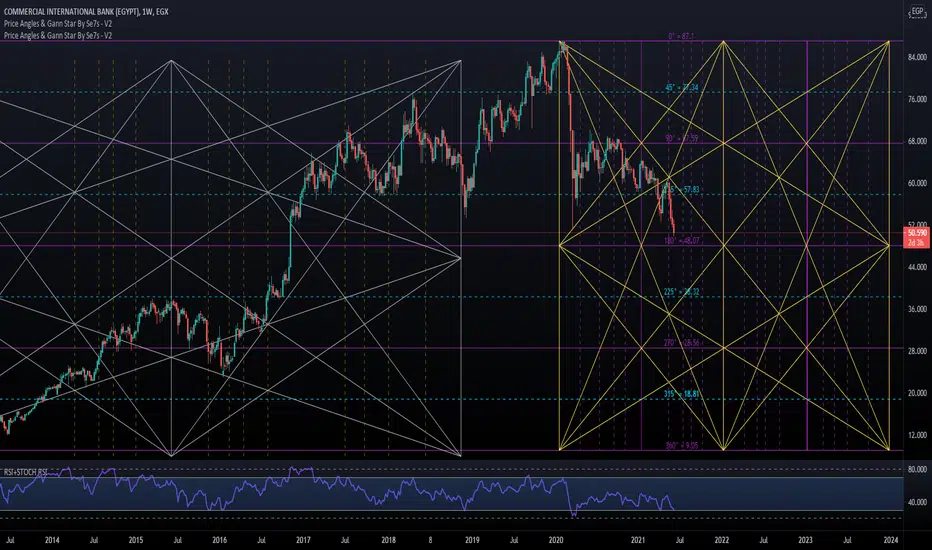
support and resistance lines..
horizontal lines are Support/Resistance .
Vertical lines are time pivots .
Appreciate your Comments.
GL
LONG term...
support and resistance lines..
horizontal lines are Support/Resistance .
Vertical lines are time pivots .
Appreciate your Comments.
GL
Nota
Now all hopes that 48.07 hold and no 2 weekly candles close below it.Incase that happened u have your levels on the chart.
Nota
LOLNota
Respect.Nota
Even though still going as planned...Nota
Holly S....Boooooom BooooOooOOOoM!
They played Wickedly!
Look at The CHart Play it!
Nota
No Coincidences Everything is Planned.
Nota
Back From The Future....i have seen it all ;)
Thank God..
Chart Published 8 JUN 2021!
Time is more important than price. When time is up price will reverse." – W. D.
Declinazione di responsabilità
Le informazioni e le pubblicazioni non sono intese come, e non costituiscono, consulenza o raccomandazioni finanziarie, di investimento, di trading o di altro tipo fornite o approvate da TradingView. Per ulteriori informazioni, consultare i Termini di utilizzo.