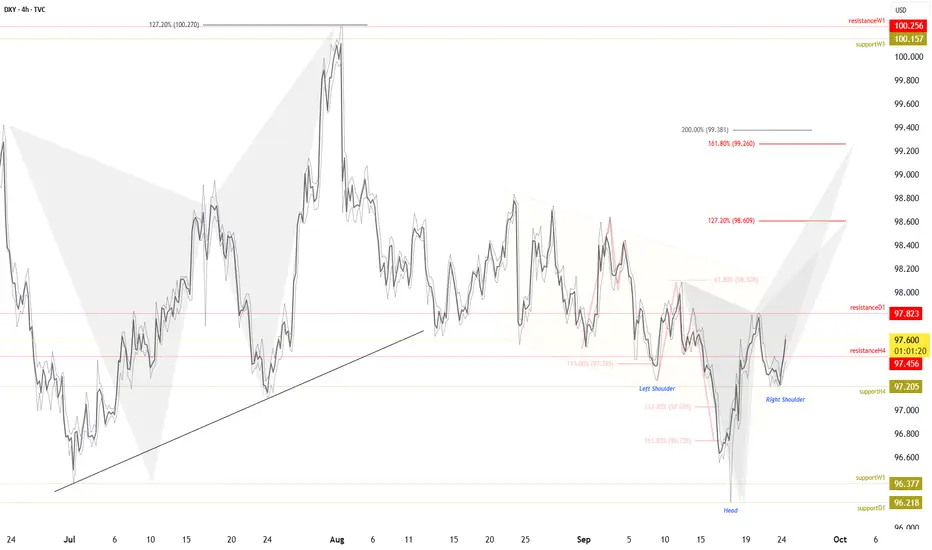
The DXY is currently consolidating in a way that suggests the development of an inverted head and shoulders pattern. We have support distributed between $96.37 and $96.21, creating a potential base for this pattern. On the upside, the recent breakout through $97.45 highlights bullish intent, with the next critical level being the daily fractal resistance at $97.82, which acts as the neckline.
Breakout Implications
A confirmed break and close above $97.82 would validate the pattern and shift momentum toward higher targets. If this scenario plays out, extension levels become the next logical zones of interest:
- 127% Fibonacci extension: $98.60 - bearish butterfly pattern
- 161.8% Fibonacci extension: $99.26 - bearish crab pattern
- 200% Fibonacci extension: $99.38 - H&S default target
Risk Factors & Harmonic Patterns
While the bullish case is clear above $97.82, caution is warranted. Harmonic patterns may begin to take shape around $98.60 and $99.26, which often serve as areas of exhaustion or reversal. These zones could lead to temporary pullbacks, and in a broader context, may even reassert the prevailing downtrend seen in recent months.
Key Takeaway
The confirmation or rejection of the $97.82 neckline will be pivotal in defining the next directional phase for the DXY. We should monitor price behavior carefully at each Fibonacci extension, balancing the potential for continuation against the risk of harmonic-driven reversals.
Safe Trades,
André Cardoso
Harmonic Patterns | Market Analyst | Forex Analytix | Porto, Portugal
Pubblicazioni correlate
Declinazione di responsabilità
Le informazioni e le pubblicazioni non sono intese come, e non costituiscono, consulenza o raccomandazioni finanziarie, di investimento, di trading o di altro tipo fornite o approvate da TradingView. Per ulteriori informazioni, consultare i Termini di utilizzo.