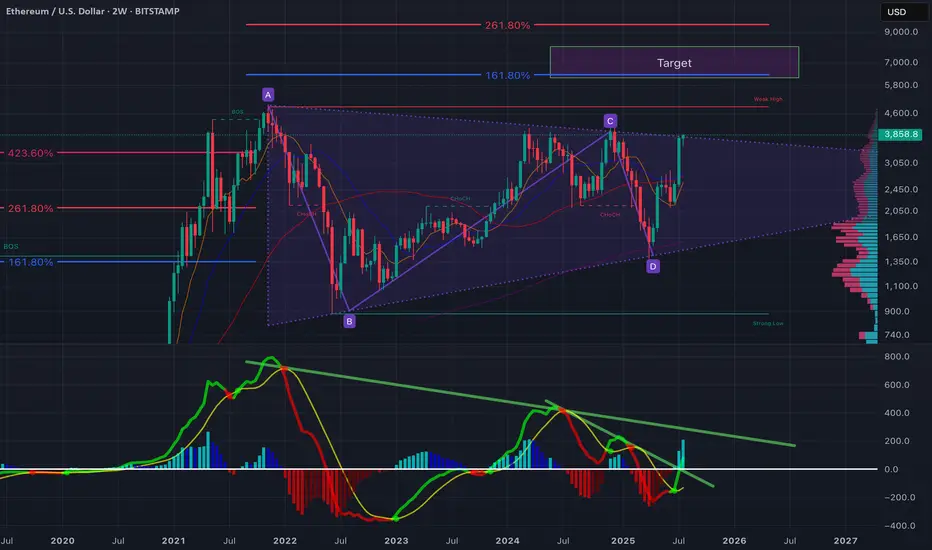
Ethereum is showing a significant breakout setup after years of consolidation within a large symmetrical wedge structure (A–B–C–D pattern). The price has just tested the upper boundary of the wedge, and momentum indicators suggest a potential mid-term bullish continuation.
Key Observations:
ABCD Harmonic Structure: Price has respected the harmonic range with D forming a strong higher low near $1,500–$1,600, showing buyer absorption at key demand levels.
Fibonacci Confluence:
The 161.8% extension aligns with ~$5,800, forming the first major target.
A 261.8% extension pushes towards ~$7,000, aligning with the marked "Target" zone.
Volume Profile: Heavy accumulation between $1,500–$2,500 with low resistance above $4,000 suggests a breakout could accelerate quickly.
MACD/RSI Divergence: The momentum oscillator shows a triple bullish divergence (higher lows on momentum vs. lower lows on price), and the downtrend line on the MACD histogram has been broken—often a precursor to sustained upside.
Moving Averages: The 50/100 EMA crossover on the 2-week chart is imminent, historically a strong macro signal.
Bullish Scenario:
A clear close above $4,000 confirms wedge breakout.
Short-term targets: $4,600 (weak high) and $5,800 (Fib 161.8%).
Macro target: $7,000+ if bullish momentum holds through Q4.
Bearish Risk:
Failure to hold $3,500 could lead to retests of $2,500 or even $2,000 (mid-wedge support).
Watch for macroeconomic shocks (rate cuts, liquidity shifts) which have previously caused retracements in crypto markets.
What’s next?
ETH is approaching a make-or-break moment. If the breakout holds, this could be the start of the next major leg up. A strong weekly close above $4,000–$4,200 is critical for validation.
Declinazione di responsabilità
Le informazioni e le pubblicazioni non sono intese come, e non costituiscono, consulenza o raccomandazioni finanziarie, di investimento, di trading o di altro tipo fornite o approvate da TradingView. Per ulteriori informazioni, consultare i Termini di utilizzo.
Declinazione di responsabilità
Le informazioni e le pubblicazioni non sono intese come, e non costituiscono, consulenza o raccomandazioni finanziarie, di investimento, di trading o di altro tipo fornite o approvate da TradingView. Per ulteriori informazioni, consultare i Termini di utilizzo.