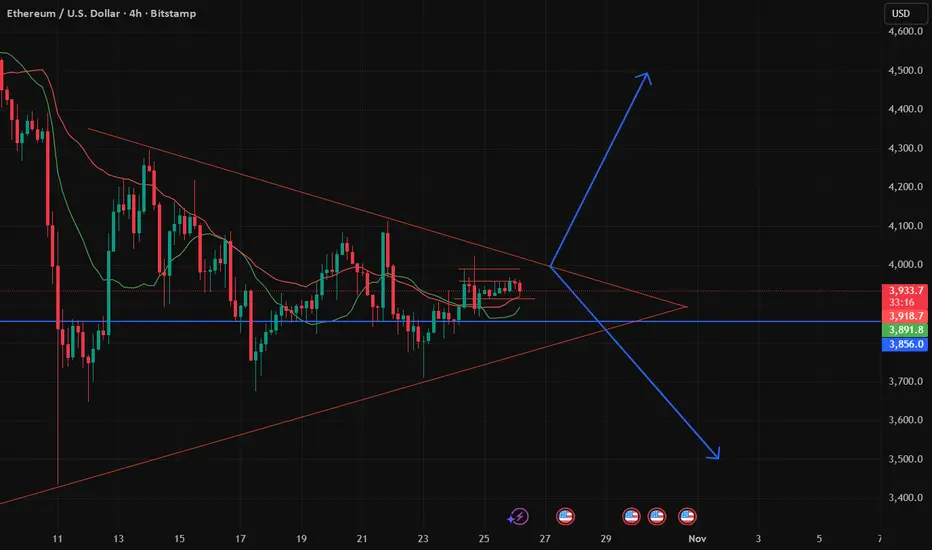
1. Validity of the pattern
A symmetrical triangle is a neutral continuation (or sometimes reversal) pattern: price makes lower highs and higher lows, squeezing into the apex.
Important for you: verify that each “touch” of the trendlines is clean (price reacts at the lines, shows rejection or bounce) — this gives the pattern structural credibility.
On the chart, “multiple clear reactions from both boundaries”.
Also note: the longer the duration of compression (here many weeks), the greater the potential breakout move. Good for you because you prefer swing trading supported by structure.
2. Entry strategy
For a bullish scenario: wait for confirmation of a breakout above ~$4,265. This could be for example a daily close above that trendline / resistance level, or a strong candlestick close + volume spike.
For a bearish scenario: wait for a confirmed breakdown below ~$3,640 (lower trendline + support) with follow-through.
Because you emphasise risk management: Place a stop‐loss maybe just outside the triangle boundary (above resistance for short, below support for long), depending on direction.
3. Risk/Reward & Targeting
The analyst’s target ~$4,720 (for the breakout) gives a potential ~10%+ move from ~$4,265. That’s decent for a swing.
On the downside, target ~$3,300 from ~$3,640 gives ~10%+ also.
For you: calculate your risk (distance to stop-loss) vs reward (distance to target) and only take the trade if the ratio is acceptable (e.g., 1:2 or better).
Given you also do scalping, you could also watch for a smaller move out of the triangle if the breakout slows, or for a retest of the breakout zone.
4. Context & confirmation
Patterns don’t always work. Use other confirmations: volume increase on breakout, maybe RSI divergence, or a candlestick structure (hammer, engulfing etc) at breakout.
Also consider macro / crypto‐market context: Are news, fundamentals, sentiment aligning with a bullish or bearish breakout?
Since you’re also into institutional footprints and liquidity zones: check if the breakout happens near a major liquidity level or order‐block; sometimes institutions will trap retail before the move.
5. Your action plan (for your “advanced path” mindset)
Mark the triangle on your charting software (e.g., MetaTrader 5 if you’re using it for crypto via feed, or a dedicated crypto charting platform).
Set alerts at ~$4,265 and ~$3,640 for price crossing these levels (you can add a buffer e.g., 1-2%).
Prepare two trade plans:
Plan-A (Bull): Entry after breakout above $4,265, stop-loss maybe ~$4,000 (for example), target ~$4,720 + beyond.
Plan-B (Bear): Entry after breakdown below $3,640, stop-loss maybe ~$3,800, target ~$3,300.
⚠️ Risks & caveats
Breakouts from triangles often see retests of the breakout line. Beware false breakouts (fakeouts).
Crypto markets (and especially ETH) can be volatile and news/whale moves can override chart structure. Always manage capital accordingly.
The triangular pattern suggests the range is narrowing: less room inside means bigger explosion once it exits — but also more risk of whipsaw.
As this is a self‐published chart by an analyst (not guaranteed) — always do your own research.
Declinazione di responsabilità
Le informazioni ed i contenuti pubblicati non costituiscono in alcun modo una sollecitazione ad investire o ad operare nei mercati finanziari. Non sono inoltre fornite o supportate da TradingView. Maggiori dettagli nelle Condizioni d'uso.
Declinazione di responsabilità
Le informazioni ed i contenuti pubblicati non costituiscono in alcun modo una sollecitazione ad investire o ad operare nei mercati finanziari. Non sono inoltre fornite o supportate da TradingView. Maggiori dettagli nelle Condizioni d'uso.