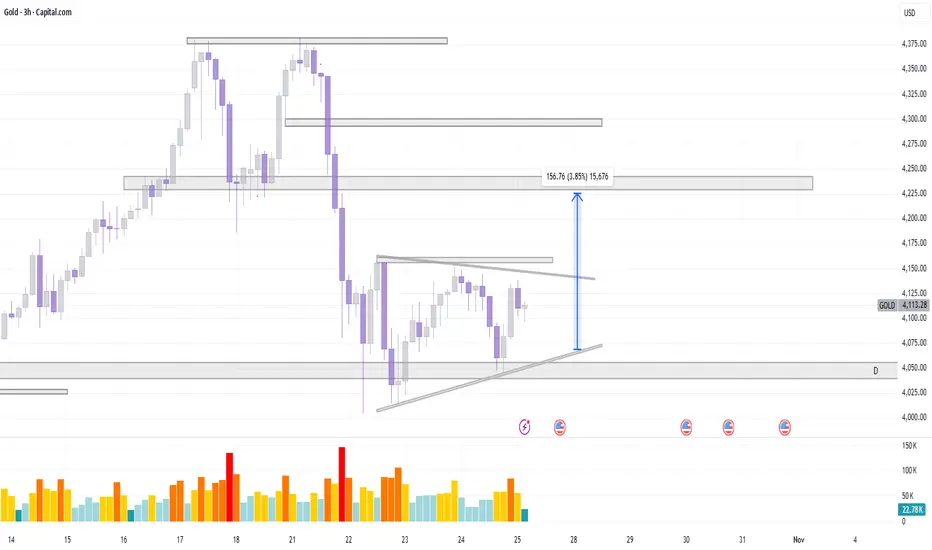
The chart displays a recent uptrend followed by a period of consolidation, which has formed a symmetrical triangle pattern.
Key Observations:
Prior Trend and Break of Structure (BOS): The price was in a strong uptrend, reaching a high near the $4,400 level. A subsequent drop broke a recent low, marked as a Break of Structure (BOS) near $4,025, which often signals a potential shift in the short-term market structure from bullish to more neutral or bearish.
Consolidation Pattern: Following the drop, the price has entered a consolidation phase, trading within a symmetrical triangle pattern (highlighted by the converging dashed lines). This pattern typically suggests indecision between buyers and sellers and is often a continuation or reversal pattern depending on the breakout direction.
The price is currently resting near the bottom of this triangle around $4,113.
Support and Resistance Zones:
Strong Support (Demand): The area around $4,025 to $4,050 is a critical support zone (marked as 'D' for Demand and the BOS line). A breakdown below this level could trigger further selling.
Resistance (Supply): There are multiple overhead supply zones (marked by the horizontal gray/white boxes) that the price needs to clear. The immediate key resistance zone is the price level that forms the top boundary of the triangle.
Declinazione di responsabilità
Le informazioni ed i contenuti pubblicati non costituiscono in alcun modo una sollecitazione ad investire o ad operare nei mercati finanziari. Non sono inoltre fornite o supportate da TradingView. Maggiori dettagli nelle Condizioni d'uso.
Declinazione di responsabilità
Le informazioni ed i contenuti pubblicati non costituiscono in alcun modo una sollecitazione ad investire o ad operare nei mercati finanziari. Non sono inoltre fornite o supportate da TradingView. Maggiori dettagli nelle Condizioni d'uso.