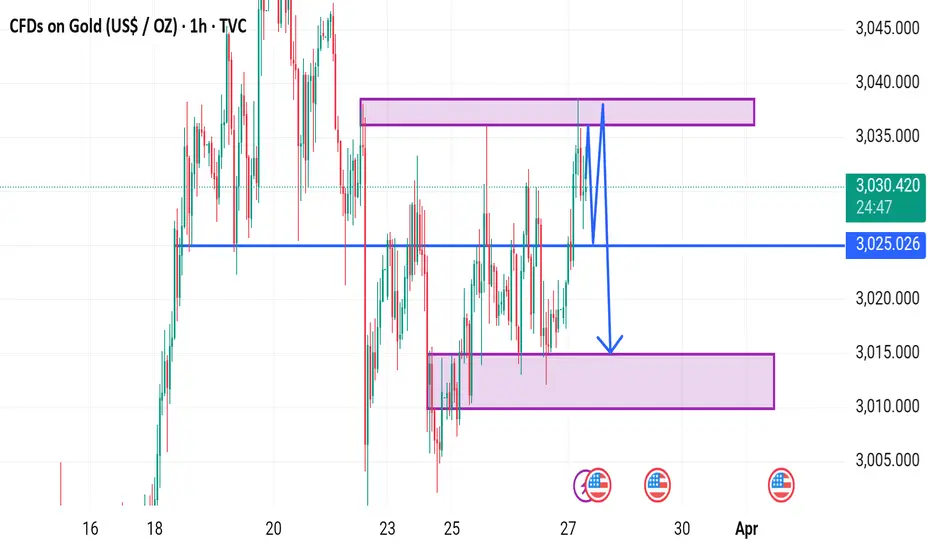
This is a gold price (CFDs on Gold - US$/OZ) chart from TradingView, showing price action on the 1-hour timeframe.
Key Observations:
1. Current Price: Around $3,030.226
2. Key Levels:
Support Zone (~$3,010) marked with a purple rectangle.
Resistance Zone (~$3,040) marked with a purple rectangle.
Key Level at $3,025 (marked with a blue horizontal line).
3. Price Action & Prediction:
The chart suggests a potential rejection at the resistance zone (~$3,040).
A possible retest of the $3,025 level before breaking downward toward the support zone (~$3,010).
The blue zigzag lines indicate expected price movement: a brief consolidation before dropping to the lower zone.
This looks like a bearish setup, where gold might test resistance, fail to break, and decline toward support.
XAUUSD GOLD + BTCUSD Daily 6-7 Free Signals📊🚀
💫Best Trading Team
✅GOLD
✅BTC
✅EURUSD
✅USDJPY
TELEGRAM CHANNEL 👇🏻👇🏻👇🏻👇🏻👇🏻👇🏻
t.me/Gold_Derive_Killer01
💫Best Trading Team
✅GOLD
✅BTC
✅EURUSD
✅USDJPY
TELEGRAM CHANNEL 👇🏻👇🏻👇🏻👇🏻👇🏻👇🏻
t.me/Gold_Derive_Killer01
Declinazione di responsabilità
Le informazioni ed i contenuti pubblicati non costituiscono in alcun modo una sollecitazione ad investire o ad operare nei mercati finanziari. Non sono inoltre fornite o supportate da TradingView. Maggiori dettagli nelle Condizioni d'uso.