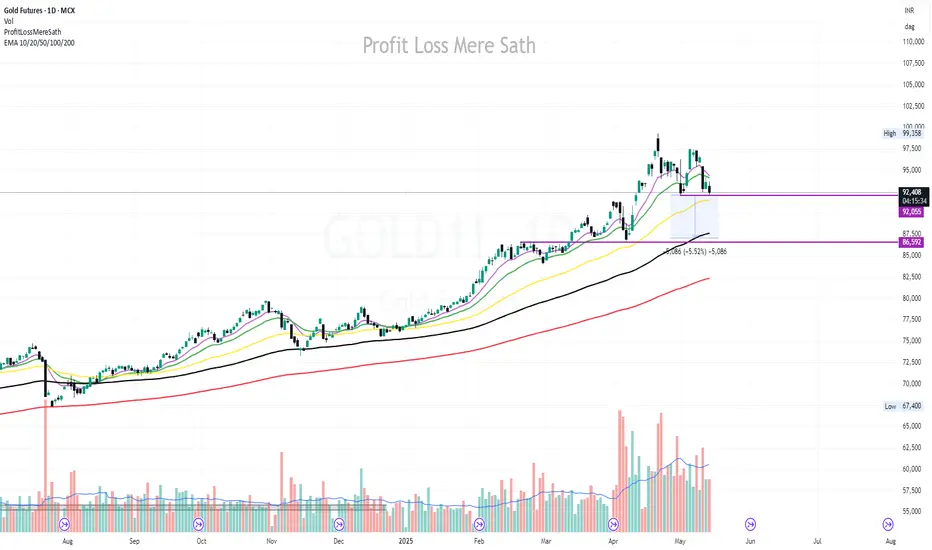
Chart Date: May 14, 2025
CMP: ₹92,558
Change: -1.16% | Volume: 14.13K
Gold has shown weakness after a strong uptrend from early February. Currently, it is consolidating near the ₹92,000 level, just above the 50 EMA (₹91,526). The price is hovering near a key support zone highlighted between ₹92,055 and ₹91,526.
📉 Key Observations:
Price rejected near recent swing high of ₹99,358.
Currently testing the 50 EMA. A breakdown below this may trigger further downside toward ₹87,500–₹86,592 demand zone.
Volume declining on recent candles – indicating weakening bullish momentum.
EMA Cluster (10/20/50) flattening out – potential trend reversal or deeper pullback in progress.
📌 Levels to Watch:
Support: ₹92,055 → ₹91,526 | Below that: ₹87,500 & ₹86,592
Resistance: ₹94,160 (20 EMA), ₹94,434 (10 EMA)
Breakdown Target Zone: ₹87,500 (5.52% from current price)
🔔 Strategy:
Wait for price action near the support zone. If breakdown confirms with volume, look for short opportunities with a tight SL above 50 EMA. Long trades only if strong reversal candles appear near ₹91.5k zone.
📊 EMA: 10/20/50/100/200 plotted for dynamic trend & support insights.
Declinazione di responsabilità
Le informazioni ed i contenuti pubblicati non costituiscono in alcun modo una sollecitazione ad investire o ad operare nei mercati finanziari. Non sono inoltre fornite o supportate da TradingView. Maggiori dettagli nelle Condizioni d'uso.
Declinazione di responsabilità
Le informazioni ed i contenuti pubblicati non costituiscono in alcun modo una sollecitazione ad investire o ad operare nei mercati finanziari. Non sono inoltre fornite o supportate da TradingView. Maggiori dettagli nelle Condizioni d'uso.