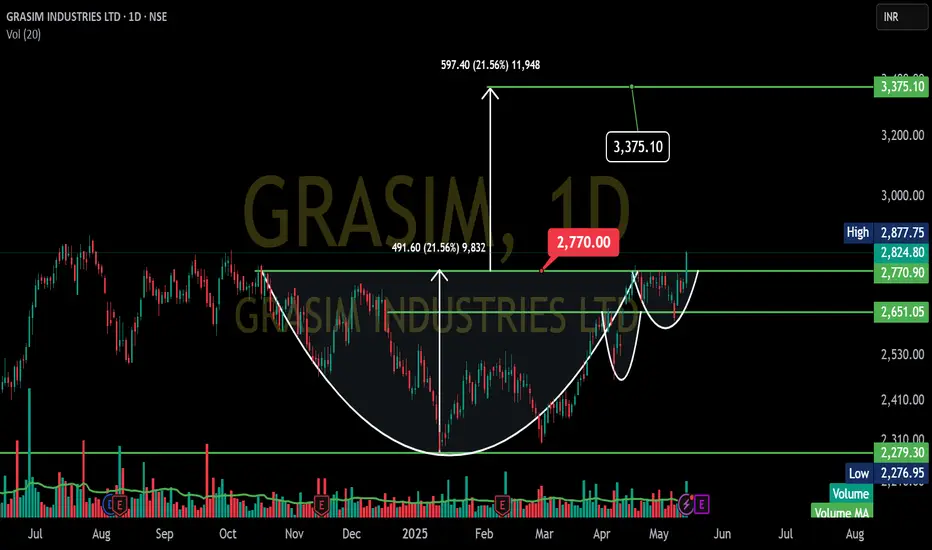
GRASIM INDUSTRIES LTD chart.
Forming a cup and handle pattern, which is generally a bullish signal.
Here's a simplified breakdown:
Cup: Notice the rounded bottom shape that formed roughly between November 2024 and April 2025. This suggests the price found support after a decline and started to move upwards again.
Handle (Potential): After reaching a high around ₹2,770, the price has pulled back a bit. This dip could be forming the "handle" of the pattern. Ideally, this handle should be a smaller downward or sideways movement.
Breakout Level: The horizontal line you've drawn around ₹2,770 acts as a resistance level. If the price breaks above this level with good volume, it could signal that the cup and handle pattern is complete and the price might move higher.
Target: Potential target around ₹3,375.10. This target is often estimated by measuring the depth of the cup and adding it to the breakout level.
Declinazione di responsabilità
Le informazioni e le pubblicazioni non sono intese come, e non costituiscono, consulenza o raccomandazioni finanziarie, di investimento, di trading o di altro tipo fornite o approvate da TradingView. Per ulteriori informazioni, consultare i Termini di utilizzo.
Declinazione di responsabilità
Le informazioni e le pubblicazioni non sono intese come, e non costituiscono, consulenza o raccomandazioni finanziarie, di investimento, di trading o di altro tipo fornite o approvate da TradingView. Per ulteriori informazioni, consultare i Termini di utilizzo.