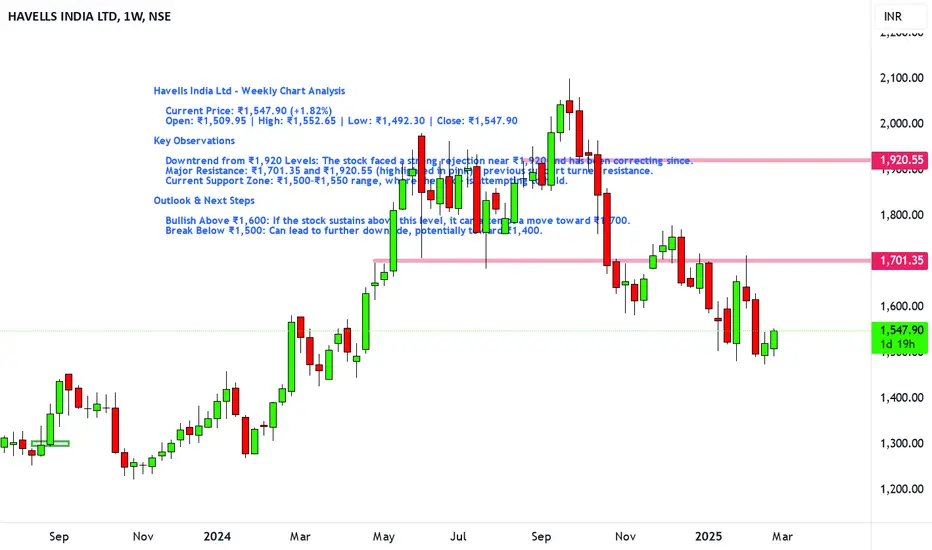
Havells India Ltd - Weekly Chart Analysis
Current Price: ₹1,547.90 (+1.82%)
Open: ₹1,509.95 | High: ₹1,552.65 | Low: ₹1,492.30 | Close: ₹1,547.90
Key Observations
Downtrend from ₹1,920 Levels: The stock faced a strong rejection near ₹1,920 and has been correcting since.
Major Resistance: ₹1,701.35 and ₹1,920.55 (highlighted in pink) – previous support turned resistance.
Current Support Zone: ₹1,500–₹1,550 range, where the price is attempting to hold.
Outlook & Next Steps
Bullish Above ₹1,600: If the stock sustains above this level, it can attempt a move toward ₹1,700.
Break Below ₹1,500: Can lead to further downside, potentially toward ₹1,400.
Automated Tools/Indicators/Screeners available at kkonline.org/nimblrta
Declinazione di responsabilità
Le informazioni ed i contenuti pubblicati non costituiscono in alcun modo una sollecitazione ad investire o ad operare nei mercati finanziari. Non sono inoltre fornite o supportate da TradingView. Maggiori dettagli nelle Condizioni d'uso.