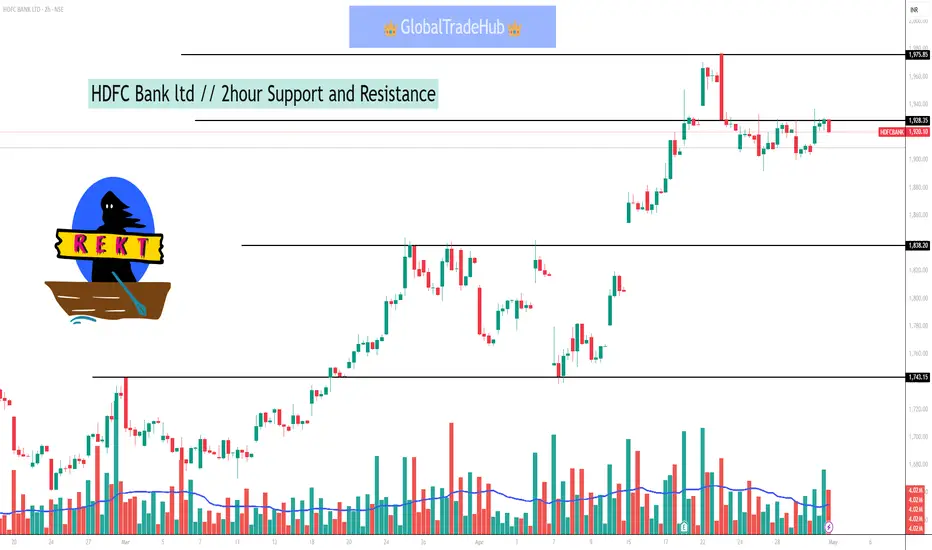
As of May 1, 2025, at 9:58 AM IST, HDFC Bank Ltd (NSE: HDFCBANK) is trading at ₹1,765. Based on recent technical analysis, here are the key support and resistance levels for the stock on a 2-hour (2H) chart:
📊 2-Hour Support and Resistance Levels
Immediate Support Levels:
₹1,746
₹1,732
Immediate Resistance Levels:
₹1,797
₹1,812
These levels suggest that if the stock price falls below the immediate support at ₹1,746, it may find the next support at ₹1,732. Conversely, if the price rises above the immediate resistance at ₹1,797, it could encounter the next resistance at ₹1,812 .
📉 Technical Indicators
ADX (Average Directional Index): 24.08, indicating a trending market.
MACD (Moving Average Convergence Divergence): Bearish crossover detected, suggesting downward momentum.
Parabolic SAR: Positioned at ₹1,714.70, indicating a bearish trend.
Super Trend: At ₹1,728.41, confirming bearish sentiment.
Bollinger Bands: Price is below the middle band (₹1,707.66), indicating potential for further downside .
Pubblicazioni correlate
Declinazione di responsabilità
Le informazioni ed i contenuti pubblicati non costituiscono in alcun modo una sollecitazione ad investire o ad operare nei mercati finanziari. Non sono inoltre fornite o supportate da TradingView. Maggiori dettagli nelle Condizioni d'uso.
Pubblicazioni correlate
Declinazione di responsabilità
Le informazioni ed i contenuti pubblicati non costituiscono in alcun modo una sollecitazione ad investire o ad operare nei mercati finanziari. Non sono inoltre fornite o supportate da TradingView. Maggiori dettagli nelle Condizioni d'uso.