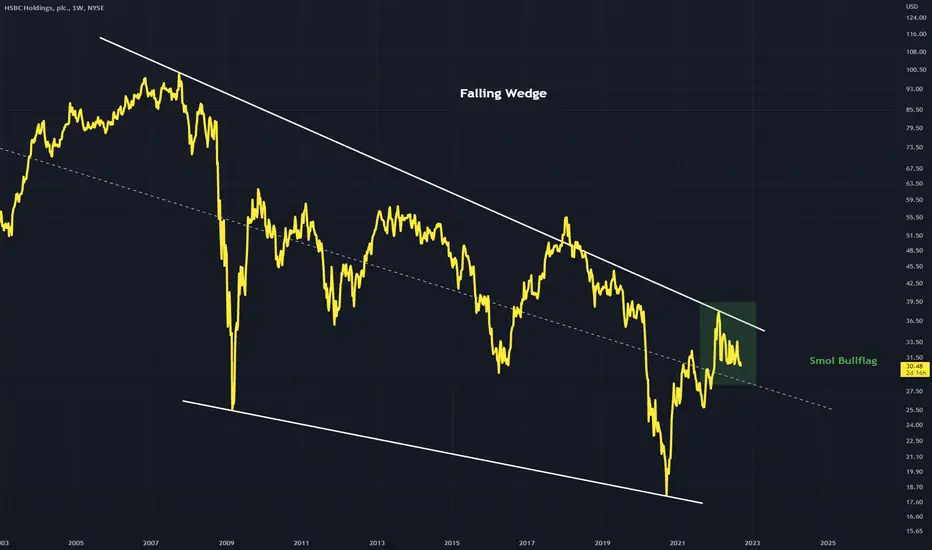
Falling Wedge structure using the peaks and troughs of price
The middle dashed line is the strongest trend line (down)
A small bullflag can also be seen forming at the bottom of this falling wedge
Will a trend change be the result?
Weekly timeframe
The middle dashed line is the strongest trend line (down)
A small bullflag can also be seen forming at the bottom of this falling wedge
Will a trend change be the result?
Weekly timeframe
Declinazione di responsabilità
Le informazioni ed i contenuti pubblicati non costituiscono in alcun modo una sollecitazione ad investire o ad operare nei mercati finanziari. Non sono inoltre fornite o supportate da TradingView. Maggiori dettagli nelle Condizioni d'uso.
Declinazione di responsabilità
Le informazioni ed i contenuti pubblicati non costituiscono in alcun modo una sollecitazione ad investire o ad operare nei mercati finanziari. Non sono inoltre fornite o supportate da TradingView. Maggiori dettagli nelle Condizioni d'uso.