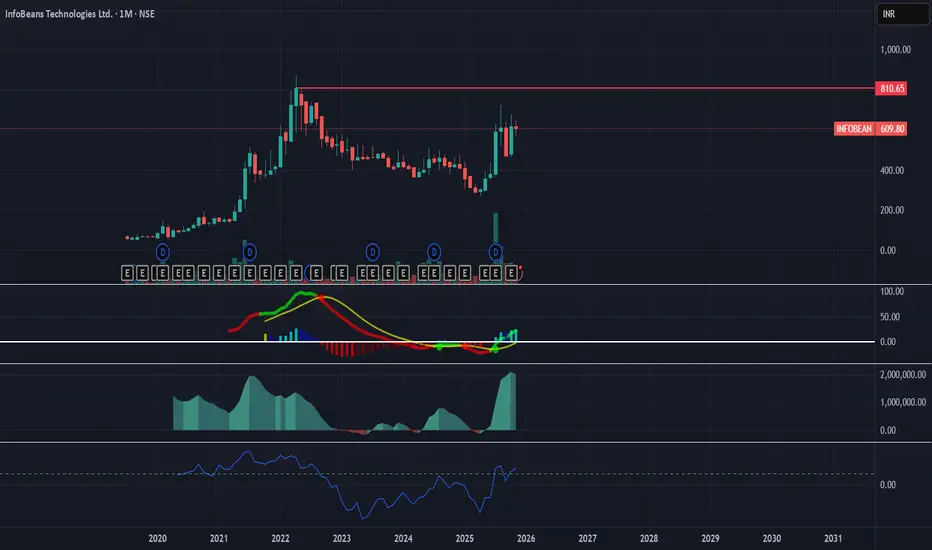
InfoBeans Technologies – Monthly Trend Reversal + Breakout Setup | Arthavidhi Analysis
🔍 Timeframe: Monthly
CMP: ₹609
Major Resistance: ₹810
Structure: Multi-month bottom + strong reversal
📈 Technical Overview
InfoBeans is showing a powerful bullish comeback after a deep 2-year correction.
The monthly chart indicates a classic trend reversal pattern with strong momentum confirmation.
Key Observations
✅ Massive volume spike (highest in years → fresh accumulation)
✅ MACD bullish crossover above signal + histogram expanding
✅ RSI back above 55 – entering bullish territory
✅ Strong V-shaped recovery from the bottom
✅ Monthly structure forming higher highs & higher lows
✅ Price heading toward major resistance at ₹810
This setup is ideal for a trend-restart + early breakout anticipation.
📊 Arthavidhi Trade Setup
🔹 Entry Zone
Buy between ₹595 – ₹620
Add more above ₹650 (momentum confirmation)
🔹 Stoploss (Monthly Close Basis)
₹495 (below higher-low support)
🔹 Targets
T1 → ₹720
(Near-term swing target)
T2 → ₹810
(Major breakout zone)
T3 → ₹1020
(If ₹810 breaks with volume)
T4 (Positional) → ₹1280
(Next untouched monthly resistance)
🎯 Trade Logic
Strong volume + rising MACD signals institutional buying.
Stock is in the early stage of a new uptrend.
Breaking ₹810 will activate a multi-month bullish expansion phase.
Pharma + IT midcaps often move in multi-leg rallies, supporting this structure.
⚠️ Risk Management
SL and trend invalidation only on monthly close
Risk ≤ 1–2% of portfolio
Partial booking recommended near ₹720–810
📌 Disclaimer
This analysis is an educational chart study based on the Arthavidhi trading process.
Not investment advice. #InfoBeans #INFOBEAN #MidcapIT #BreakoutTrading #TrendReversal #SwingTrading #PositionalTrade #Arthavidhi #TechnicalAnalysis #PriceAction #NSEStocks #MomentumStocks
Declinazione di responsabilità
Le informazioni e le pubblicazioni non sono intese come, e non costituiscono, consulenza o raccomandazioni finanziarie, di investimento, di trading o di altro tipo fornite o approvate da TradingView. Per ulteriori informazioni, consultare i Termini di utilizzo.
Declinazione di responsabilità
Le informazioni e le pubblicazioni non sono intese come, e non costituiscono, consulenza o raccomandazioni finanziarie, di investimento, di trading o di altro tipo fornite o approvate da TradingView. Per ulteriori informazioni, consultare i Termini di utilizzo.