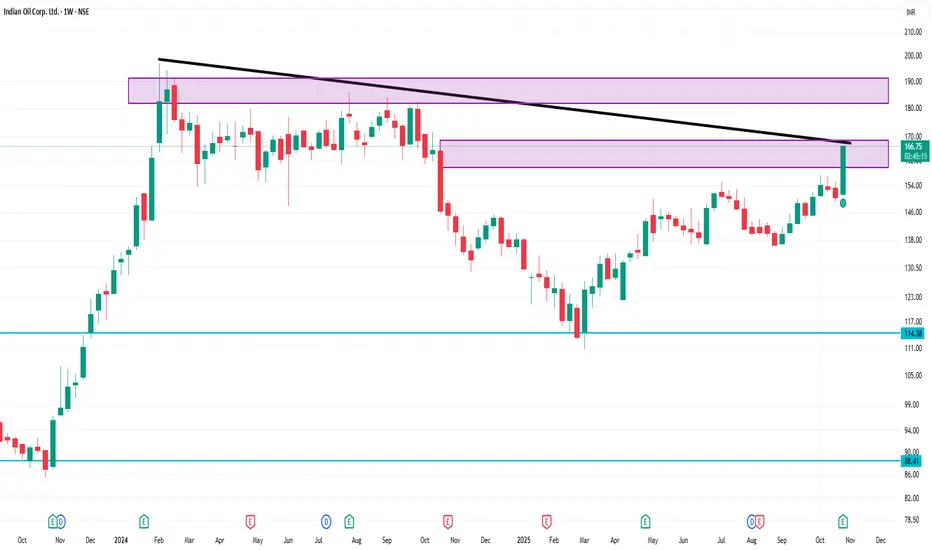
📍 Key Levels to Monitor (weekly chart)
Support zone: ~ ₹150-155. This is a region where past moving averages / consolidation occurred (also near 200-week MA).
Near-term support: ~ ₹160. If price dips, watch for reaction around this level.
Resistance / breakout area: ~ ₹166-170. Past highs / pivot region. If price convincingly breaks above this with volume, higher targets could be triggered. In the daily technicals, pivot-classic R1 ~ ₹166.54.
Next upside potential: If breakout happens, next zone maybe ~ ₹175-180 (psychological+historic highs) — but only once structure is confirmed.
Risk trigger: A close below ~ ₹150 might shift trend bias to more neutral/weak.
Pubblicazioni correlate
Declinazione di responsabilità
Le informazioni e le pubblicazioni non sono intese come, e non costituiscono, consulenza o raccomandazioni finanziarie, di investimento, di trading o di altro tipo fornite o approvate da TradingView. Per ulteriori informazioni, consultare i Termini di utilizzo.