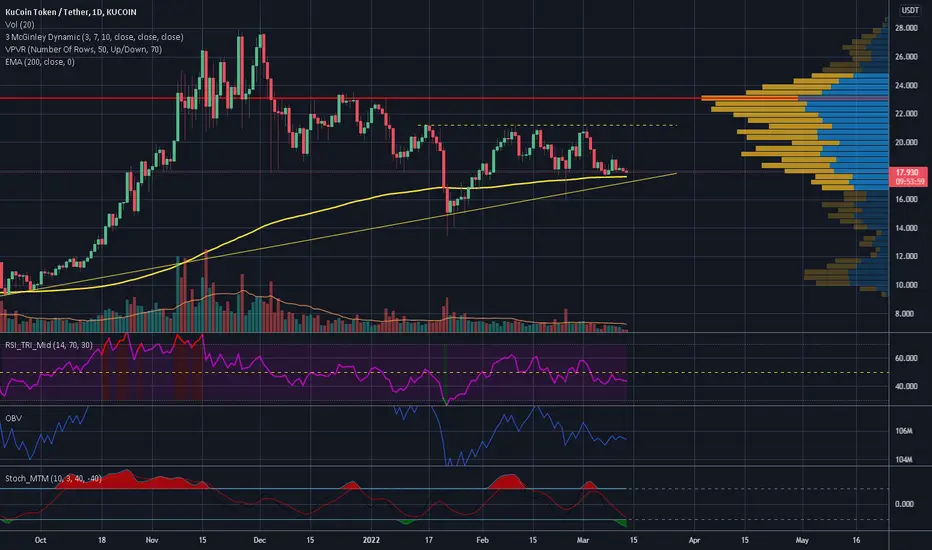
KCS has been hitting a resistance since 16th of January but with time EMA 200 rose and price it's now enclosed between that and the resistance at 21.192 USDT. From a chart pattern point ov view this appears like a rising asymetrical triangle and even the fact that volume is decreaseing could be in line with a possible upcoming breakup which is a very good bullish pattern but overall indicators are uncertain.
I think you could start DCA if price hit lower support and bounce back OVER EMA 200, and despite this you should use a stop loss anyway considering the current market situation. Right now I wouldn't give anything for accounted.
If instead it breaks downwards you might look for shorting opportunities (I'll post some updates if I can).
Our number one rule now must be not risking anything and avoid to remain trapped with some bags (trust me I speak by personal experience).
Good luck
I do TA because I like and it seems at least 70% of my calls usually turn out to be true. If you wanna support me please donate some tradingview coin or check "about me"
Declinazione di responsabilità
Le informazioni ed i contenuti pubblicati non costituiscono in alcun modo una sollecitazione ad investire o ad operare nei mercati finanziari. Non sono inoltre fornite o supportate da TradingView. Maggiori dettagli nelle Condizioni d'uso.